Out of Stock
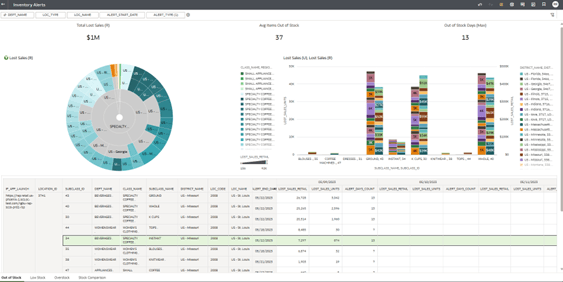
The Out of Stock report is structured into a header section and three distinct canvases, each providing a different perspective on stockout issues to support comprehensive analysis and informed decision-making.
This alert identifies when a critical threshold of lost sales has been met. For this alert the thresholds can be exceeded over any number of concurrent days, it is not limited to each individual day exceeding a threshold. This allows the business to set more meaningful (financially significant) thresholds.
It’s considered Out of Stock (OOS) the occurrences triggered by the Shortage Alert according to the rules set in Alert Management tool.
Figure 1-37 Inventory Alerts - Out of Stock

Header Section
At the top of the report, there is a header featuring three key performance tiles that summarize critical metrics related to out-of-stock situations:
- Total Lost Sales (R): Displays the total value of lost sales in retail currency (R) due to stockouts across all relevant products and locations within the selected time frame.
- Average Items Out of Stock: Shows the average number of distinct items that were out of stock, providing an indicator of the overall breadth of stockout issues.
- Out of Stock Days (Max): Indicates the maximum number of consecutive days an item was out of stock, helping to identify severe or prolonged stock availability issues.
These tiles serve as quick, high-level indicators of the overall impact of stockouts on business performance based on the filter selected by the user.
Canvas 1 – Lost Sales (Retail) by Class and Location
The first canvas provides a visual representation of lost sales in retail value segmented by product class and location. A radial chart (or circular chart) is displayed on the top-left side of the canvas.
The chart illustrates Lost Sales (R), broken down by Class and Location (store or distribution center), allowing users to quickly identify where the highest financial losses due to out-of-stock situations are occurring.
Canvas 2 – Lost Sales (Unit and Retail) by Subclass and District
The second canvas offers a comparative analysis of lost sales, focusing on both unit and retail value metrics:
A bar chart is used to display:
-
Lost Sales (U): Total quantity of units lost due to stockouts.
-
Lost Sales (R): Total retail value of the lost sales.
These metrics are segmented by District and Subclass.
District represents the higher-level grouping above the Location level at location hierarchy, and Subclass the higher-level grouping above Style level.
This view helps users analyze how different geographical areas and product segments contribute to lost sales, supporting more targeted inventory management strategies.
Canvas 3 – Detailed Data Table
The third canvas contains a comprehensive data table that provides detailed, time-phased metrics for in-depth analysis:
The table includes the following key metrics:
-
LOST_SALES_RETAIL: The monetary value of sales lost due to out-of-stock situations.
-
LOST_SALES_UNITS: The number of units that could not be sold because of stockouts.
-
ALERT_DAYS_COUNT: The number of days during which the stockout condition was active.
Data is presented in a time-phased format, showing the specific days when lost sales occurred, allowing users to identify patterns, trends, or recurring issues over time.
Additionally, the table displays the hierarchical structure above the Subclass level (Class and Department)
This detailed breakdown enables users to perform granular analyses of stockout events, understanding not only when they occurred but also how they relate to the broader organizational structure of products and locations.