Rebalancing Transfers
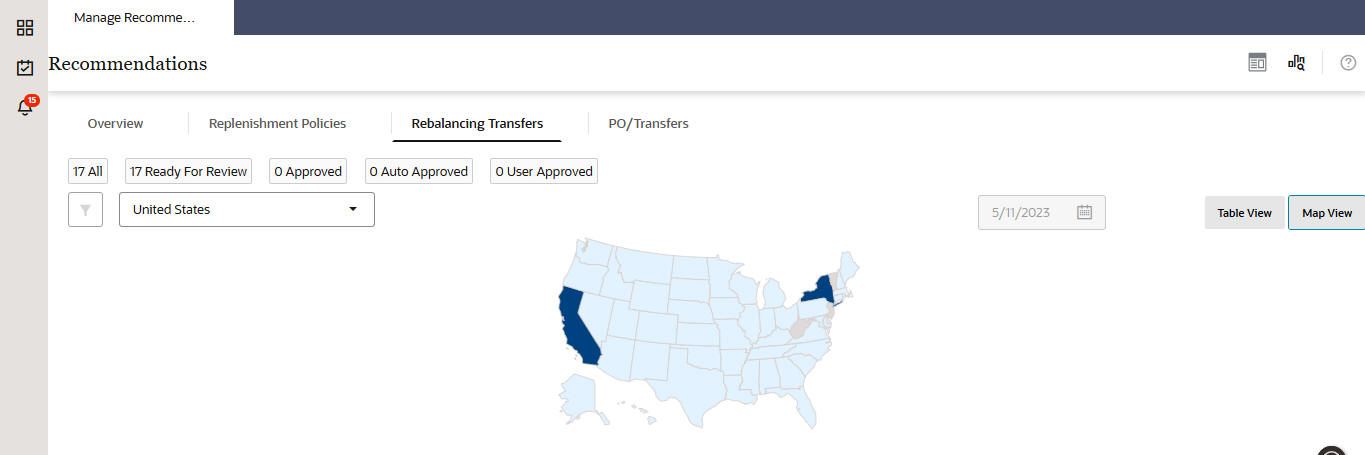
The Rebalancing Transfers section has two views, the Table View and the Map View. To switch between Table View and Map View, use the buttons located in the top right.
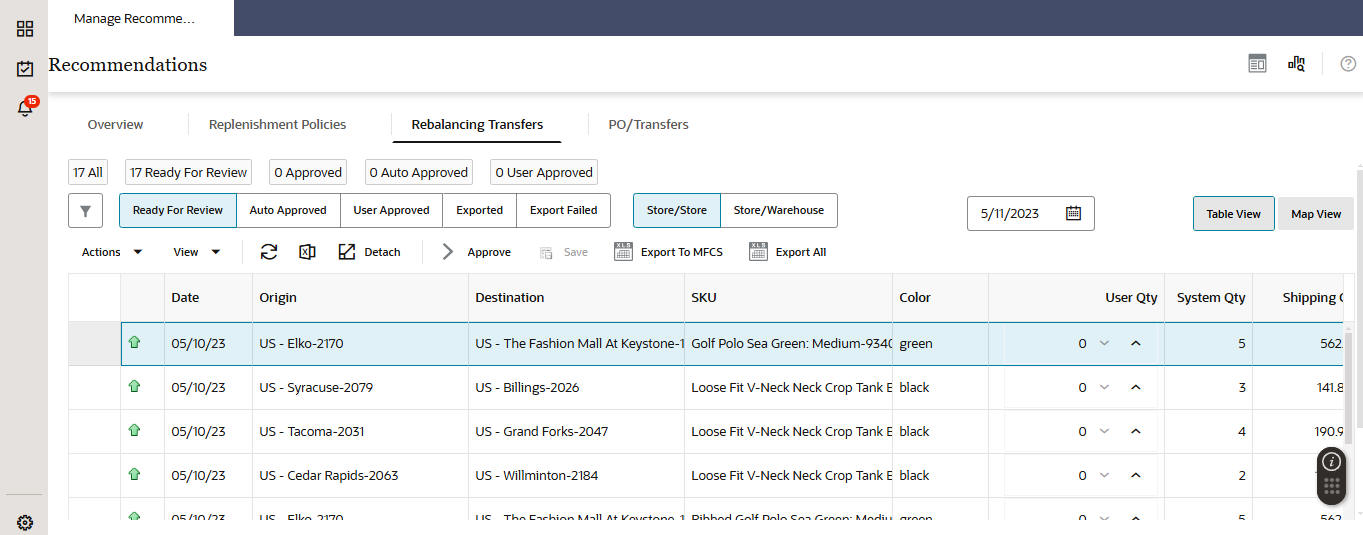
The Table View displays the recommended store-to-store transfers. The user can override the transfer quantity and submit or approve the recommendation. If submitted, the transfers are pushed to the retailer's order execution system and must be approved before they are executed. If approved, the transfers are pushed to the retailer's execution system in approved mode and will be executed on the transfer date.
Figure 1-7 Rebalancing Transfers Table View

Description of "Figure 1-7 Rebalancing Transfers Table View"
The number tiles above the table shows the total number of recommendations with different statuses across all merchandise and locations.
The Map View displays the number of transfers within each area of the map (for example, within each state of the United States). If a transfer is between two different areas, it is only included in the area where the origin is located. Clicking on an area in the map opens a pie chart that shows the breakdown of transfers based on transfer quantity.
In the contextual area of the table view, the top area shows the flow of inventory between the origin and the destination, as well as to and from other origins and destinations. The bottom area in the contextual area shows information such as product image, inventory quantities, and forecast sales at the destination. To see a more detailed view of sales and forecast and both the origin and the destination, you can click the View More Details button at the bottom of the contextual area.
