Plan View
The retailer's most significant investment is the retailer’s inventory. Inventory Planning Optimization Cloud Service (IPO) offers the retailer the ability to best predict how much demand there will be and to deploy the inventory to optimize the demand throughout the course of an item's life cycle. Throughout an item’s life cycle, the application reacts to changes in consumer behavior in order to right size inventory deployment and demand methodologies.
The end result allows the retailer to manage the current and future inventory at scale to ensure the right products and quantiles are in the right place for the right customers at the right time, in an automated and intelligent way, through the user interface.
The Inventory Plan View allows you to view a projection of inventory and order recommendations during a specific time frame.
Use the main plan view to perform the major part of your analysis. This view helps to break down the components of the inventory and provides insights into the calculated target stock levels (Order Point (OP) and Order Up to Level) that drive ordering. In this view you see receipts increasing inventory but also see the order recommendations on the order date. These order recommendations create demand on the source that can be viewed in the warehouse or supplier tab, depending on the location's source.
Days that exceed Alert thresholds are highlighted so you can visually identify periods of concern. You can then make tactical policy overrides that can then affect any future stock order recommendations.
To view the time-phased plan, complete the following steps:
-
Enter your time frame (see Time Frame).
-
Define the products and locations using the filter (see Main Filter).
-
Click Apply on the Main Filter to update the Plan View based on your choices.
-
Use the Cycle area arrows in the top right to navigate through the products (see Cycle Area).
-
The chart and tables always display information about the product that is in focus.
-
Use the Supply Chain tabs to inspect metrics from the supplier, warehouses, or stores (see All Locations Table).
Main Filter
Use the Main filter to restrict the scope of the Plan View to a subset of products and locations.
To access the Main Filter, click the Filterbutton in the top left of the Plan View.
Figure 1-9 Filter Button

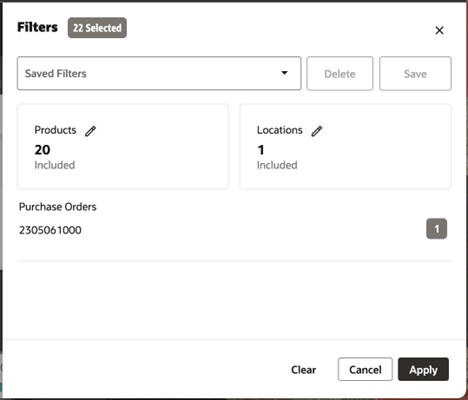
The Main Filter provides a launching area providing access to the Product and Locations filters and the sub-filter Purchase Orders.
Figure 1-10 Filter Panel Card

Click a card to open the corresponding filter panel.
When making filter selections you can enter text in the filter search field at the top of the filter to reduce the list to thosethat contain that text.
Use the Purchase Orders sub-filter to select purchase orders whose products and locations will be included on the Main filter.
- If a purchase order has been selected, and then additional products or locations are selected, then a Resync message will be displayed on the Main Filter.
- ClickingResync to Filters will reset both products and locations to those matching the purchase order selections.
Saving Your Filters
The entire set of filter selections can be stored for later retrieval. This is useful for creating watch lists of top items, bottom items, new locations, new product introductions, and so on.
To save a filter, enter a name into the Saved Filters field, then click the Save button.
Previously saved filter sets can be selected from the drop-down list. This will reload those saved filter selections in the Main Filter.
Use the Delete button to permanently remove the filter set that is currently selected in the drop-down list.
Figure 1-11 Saved Filters
Time Frame
The time frame of the Plan View can be set using the From and To date fields at the top.
Select Daily to display each individual day in the plan; select Weekly to show information for each week.
Figure 1-12 Time Frame

Cycle Area
The Plan View focuses on one product at any time. You can use the Cycle Area to traverse through the individual products that are included in the filter selection.
The Previous and Next buttons can be used to move sequentially through the list of included products.
Figure 1-13 Cycle Area

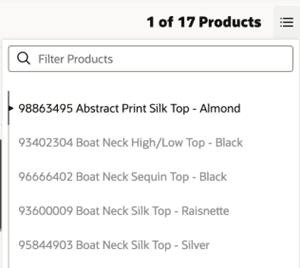
Click the Product Selection control (to the left of the arrow buttons) to display a list of products to select from. Use the search filter at the top to reduce the product list to those that contain the search term.
Figure 1-14 Product Selection

Chart
The chart area shows aggregate store information that is based upon the scope of the Plan View (Filter Selection and Time Frame).
The chart is unaffected by the Edit Metrics selection.
Figure 1-15 Plan Chart

If at least one promotion exists for a given date, then a Promotions disc will appear above the chart. Click the Promotionsdisc to show the Promotions Details and Offers to the right of the Plan.
Edit Metrics
Use the Edit Metrics button to control which metrics rows appear in the Plan View tables.
Figure 1-16 Edit Metrics

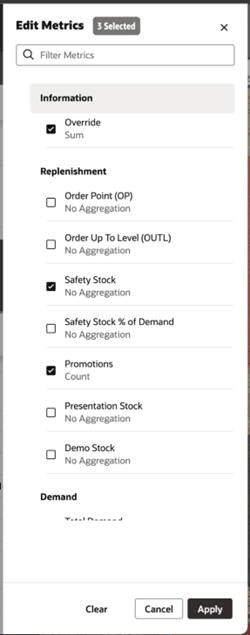
Click theEdit Metricsbutton to display the Edit Metrics panel where you can select metrics.
For each metric, the aggregation method is shown beneath the metric name. Some metrics do not have an aggregation method and will not appear in the aggregate area tables.
Figure 1-17 Metrics Selection

Metrics
Many different metrics can be displayed in the Plan View.
- The Promotions metric shows the number of promotions for that time period.
- The Override metric shows a disc at the start of any period indicating that an override has been specified by any user in Inventory Planning.
- Definitions of the other standard metrics are described below.
Replenishment Metrics
Replenishment metrics help you understand what order quantity is being recommended and the various inventory targets.
- Order Point (OP)
Order Point is the inventory level that determines at what point an order needs to be placed for an item/location. It contains the minimum number of units you want on hand for the item. When the net available inventory falls below the order point, the item is replenished.
Order Point (OP) is calculated from the Replenishment Engine
It has no aggregation method on non-Calendar hierarchy.
The aggregation method is Average from day to week.
- Order Up To Level (OUTL)
Order Up To Level (OUTL) determines the level to which inventory needs to be ordered – often the maximum quantity for the item/location. It contains the maximum number of units you want on hand for the item/location.
Order Up To Level (OUTL) is calculated from the Replenishment Engine
It has no aggregation method on non-Calendar hierarchy.
The aggregation method is Average from day to week.
- Safety Stock
Based on the identified need and the volatility in future demand, this is the additional units that are needed to meet the desired service level and prevent stock-outs
It has no aggregation method on non-Calendar hierarchy.
The aggregation method is Max from day to week.
- Safety Stock % of Demand??
This metric is calculated as the % of Safety Stock units in terms of Total Demand over review time.
It has no aggregation method on non-Calendar hierarchy.
The aggregation method is Max from day to week.
- Promotions
The Promotions metric shows the number of promotions for that time period. The Promotions are interfaced from RAP.
The aggregation method is Count.
- Presentation Stock
Presentation Stock is the minimum amount of stock required to fill a facing in the store. This can be an input from business strategies or interfaced from MFCS.
It has no aggregation method on non-Calendar hierarchy.
The aggregation method is Max from day to week.
- Demo Stock
Demo Stock is an extra quantity of an item desired at a location. It is considered sellable.
Commonly, this is used for a particular product that is made available to customers to demo in the store, but it could be used for other purposes as well. This can be an input from business strategies or interfaced from MFCS.
It has no aggregation method on non-Calendar hierarchy.
The aggregation method is Max from day to week.
Demand Metrics
The demand metrics help you understand what inventory quantity is expected to be consumed from a location—either from forecasted sale, back orders, or planned transfers to other locations.
- Demand
This is the forecasted demand calculated from IPO Demand Forecasting or aggregated from destination’s unconstrained order forecast.
For Stores, this is the approved IPO demand forecast.
For Warehouses, it is the aggregated order forecast from destinations.
The aggregation method is Sum.
- Total Demand
Total of all unconstrained demand used to calculate safetystock and forecast based replenishment boundaries.
For Stores, this is the forecast demand (the same as in Demand)
For warehouses, this is the aggregation of unconstrainted order forecasts from all destinations plus Additional Demand where flagged for inclusion.
The aggregation method is Sum.
- Constrained Demand
Constrained demand represents the demand that is met by the projected inventory. It is used to calculate inventory positions (and order boundaries within lead time).
For Stores this is the forecast demand met by the projected inventory.
For warehouses, this is the destination demand met from the warehouse. It is also the total order qty to destinations in the displayed time period.
The aggregation method is Sum.
- Backorder
This is the inventory that was already sold but could not be fulfilled due to there being no physical inventory at the time of sale. This is interfaced from MFCS.
This is expected to be a point-in-time value, so it is not repeated every day. It can be placed on the first day of the time period displayed.
It has no aggregation method.
-
Pack Unconstrained Demand
This is the demand on the warehouse rounded to ideal packs. This is used to calculate replenishment pack need at the warehouse.
-
Pack Constrained Demand
This is the actual units given from the warehouse according to the available packs. The difference between Pack Constrained Demand and Constrained demand tells you the Eaches fulfillment from the warehouse.
Inventory Metrics
Inventory metrics show what inventory is expected to arrive from open orders; what IPO recommends receiving; finally, based on forecasts, what the overall inventory levels are projected to be when following the order recommendations.
- Receipts Expected
On-Order Inventory at the destination location shown on the day that it should arrive.
The aggregation method is Sum.
- Receipt Forecast
Inventory receipt that is that is recommended by IPO and constrainedby source availability. The visibility of this inventory movement is limited to IPO until the order day is reached and the order is approved. The Receipt Forecast shows inventory on the day that it should arrive at the destination location.
The aggregation method is Sum.
- Order Forecast
Shows the constrained order recommendation on the day the order should be approved within IPO and sent to MFCS for execution. It is identical to Receipt Forecast but shown on the order date rather than receipt date.
Location order forecasts are also aggregated to Supplier so you can review total recommended supplier purchase order quantities by order date.
- Inventory (BOP)
Beginning of day inventory at a location. It is Stock on Hand, or previous day's Inventory (BOP) + all inbound inventory previous day – outbound inventory previous day.
Inbound inventory is Receipts Expected and Receipts Forecast.
Outbound inventory is Constrained Demand and open order quantity waiting for shipment (i.e. allocations)
Inventory is never negative.
The aggregation method is Sum on non-Calendar hierarchy.
The aggregation method from Day to Week is First.
- Net Inventory
This is a calculation of the inventory projected to be available to meet the target stock level for a review period. This is an order-day value. It is the inventory compared to OP/OUTL during replenishment.
There is no aggregation method on non-Calendar hierarchy.
The aggregation method from day to week is Min.
-
Pack Total Avail. Units
This provides the sum of units belonging to a pack. These units cannot be transferred as Eaches.
- Lost Sales
This is today'sInventory (BOP) + inbound (Receipt Forecast, Receipt Forecast), minus outbound (Total Demand).
The aggregation method is Sum.
- Lost Sales % of Demand
This is calculated as % of: Lost Sales divided by Total Demand.
The aggregation method is Recalc.
Location Tables
The top table is the "All Locations" table. This table aggregates data from the individual locations to display a summarized supply chain view. As with the rest of the Plan View, this area restricts information to those locations included in the filter that replenish the product currently in focus. Only metrics related to the chart are shown in the aggregate table.
Figure 1-18 Aggregate Table

For complete analysis of the time phased plan the individual location tables provide the complete set of replenishment metrics such as the Order Point, Order Up To Level, andother target stock level metrics.
The supply chain can be reviewed through the provided tabs:
- Supplier - The Supplier tab displays information about those suppliers that provide the product into the supply chain
- Warehouses – The Warehouse tabs displays information about those warehouses that handle the product for all the included stores. If the product passes through multiple warehouses on the way to the store, then multiple warehouse tabs will be displayed. Warehouse data is not aggregated into a single total
- Store - The Stores tabs show information about those stores that replenish the product.
Data for the selected metrics will be shown in the tables either for each day (if Daily is selected) or each business week (if Weekly is selected). In the Inventory Plan, you will review the warehouse inventory of the sellable SKUs. This allows you to compare forecast demand and store need to the warehouse's availability. Alerts and replenishment needs are also calculated on the sellable SKU.
Click the table date to open the Advanced Options Panel.
- Clicking the date on the All Locations table will open the panel with all locations available
- Clicking the date on a store table or warehouse table will open the panel with that destination and its source warehouse available
If any alerts are present for a given date column, then an icon will be displayed in the column header.
- An up arrow will be displayed for an Overstock Alert.
- A down arrow will be displayed for a Low Stock or Out of Stock Alert.
- A double ended arrow will be displayed if both up and down can be shown.
Figure 1-19 Table Alerts Icons