3 Contextual Reports
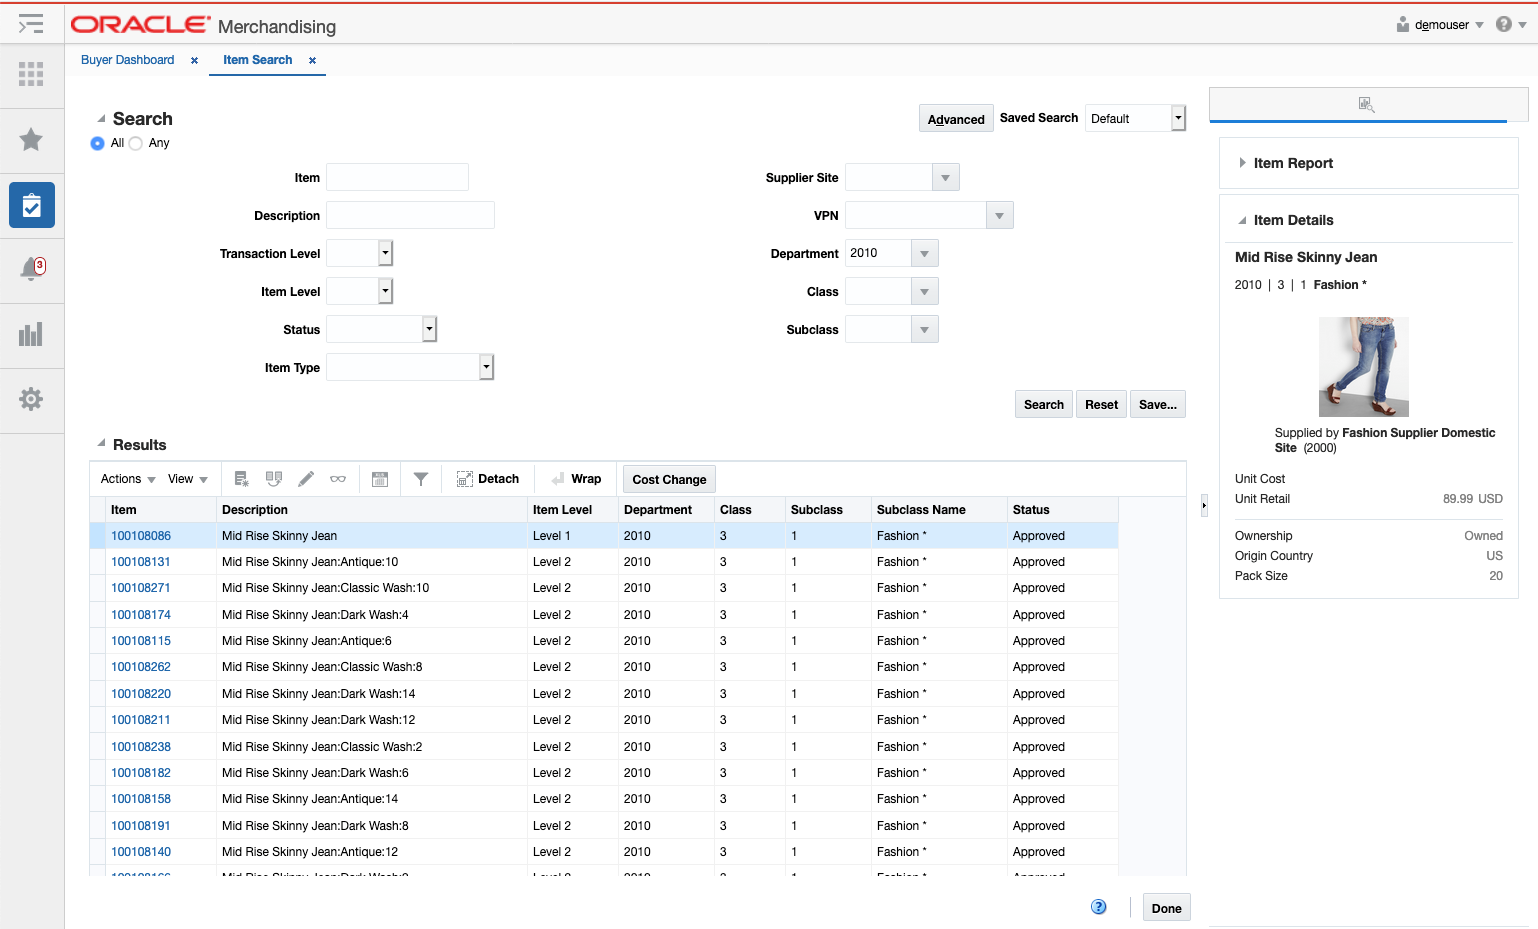
Contextual Reports are displayed in a collapsible pane of some Merchandising pages to provide additional information to the user in the context of a particular workflow, to aid in decision making. The reports are considered contextual, as the data displayed in the page influences what is displayed in the report.
The contextual pane also offers opportunities for customization of the solution. See the Merchandising Customization and Extension Guide for more details on modifying the base reports displayed in the Merchandising contextual panes or adding custom reports.
Figure 3-1 Contextual Reports
Item Details Report
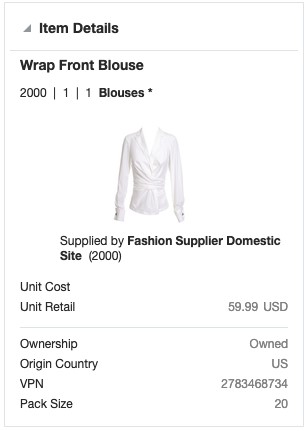
Item Details report shows additional item information that may not be available in the associated screen, such as merchandise hierarchy, supplier, cost and retail, country and pack size. This report is displayed by default in various screens that have item, like Item Search and Order Details. The information shown in the report differs slightly based on the data passed from the screen where the report appears.
Figure 3-2 Item Details Report
| Metric | Description |
|---|---|
|
Item Description |
Shows the description of the item. |
|
Merchandise Hierarchy |
Shows the ID of the department, class and subclass to which the item in the report belongs followed by subclass name. |
|
Item Image |
Shows the primary image associated with item, if available. If an image does not exist, then the default item image defined at the system option will be used. |
|
Supplier Site |
Shows the name and ID of the supplier site passed by the screen. If not available, then shows the primary supplier site name and ID. |
|
Unit Cost |
Displays the unit cost of the item. If the cost unit of measure is not EA, then it also displays the UOM (e.g. 2.00 USD per KG). The currency used for the cost differs based on the information shared by the screen where it is displayed:
|
|
Unit Retail |
Displays the unit retail of the item. If the selling unit of measure for the item is not EA, then it also displays the UOM (e.g. 10.00 USD per LB). If the screen where it is displayed does not pass the currency code, then the following will be used to determine which currency to use:
|
|
VPN |
Displays the VPN for the item associated with the supplier site displayed. If supplier is not passed from the screen to the report then VPN of primary supplier is used. |
|
Origin Country |
Displays the ID of the country of origin associated with the item and the supplier site.
|
|
Pack Size |
Displays the pack size of the item/ supplier site/ country of sourcing.
|
This report is displayed in the contextual pane of the following screens by default.
-
Item Search
-
Item
-
Item Children
-
Item Children by Diff
-
Simple Pack Setup
-
Simple Pack View
-
Related Items
-
Order Distribution
-
Order Details
-
Transfer Details
-
Mass Return Transfer
-
Stock Count Results
-
Contract
Margin Impact Report
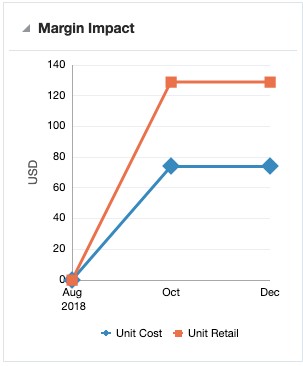
Margin Impact report provides additional information about item margin in the Cost Change by Item and Cost Change by Location screens. The report shows the cost, retail and margin values for cost and retail change events as they relate to the effective date of the given cost change. The blue line plots the cost change events for a time period based on the Margin Impact Month Range report system option from the effective date of the cost change being viewed. The red line plots similar points, but for retail price changes. It is contextual to the item, supplier, origin country and effective date in Cost Change by Item screen and to the item, location and effective date in the Cost Change by Location screen.
The report is displayed only for cost changes that have an effective date on or later than the current business date.
Figure 3-3 Margin Impact Report - In-context
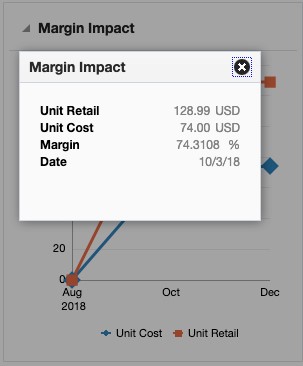
Clicking on plotted points on the graph will display a popup with the specific details for that point on the graph.
| Metric | Description |
|---|---|
|
Date |
Displays the event date when a cost change is occurring or will occur in the future. |
|
Unit Cost |
Displays the cost retrieved from the future cost table for the date. If that is not available, then the current cost for the item/supplier/country or item/supplier/country/location is shown. Additional notes:
|
|
Unit Retail |
For each cost change event plotted, the unit retail of the item on the date will also be plotted. When this report is displayed in Cost Change by Item screen, the unit retail used for display will be based on a location in the primary zone. This location is used to retrieve both past and future retail values for consistency. When this report is displayed in Cost Change by Location screen, the unit retail displayed corresponds to the location selected in the table. Additional Notes:
|
|
Margin |
The margin of the item is computed based on the cost/price identified for date and the markup calculation type of the item's department. For retail: Margin% = (Unit Retail - Unit Cost) / Unit Retail * 100 For cost: Margin% = (Unit Retail - Unit Cost) / Unit Cost * 100 |
This report is displayed by default in the contextual pane of the following Screens:
-
Cost Change by Item
-
Cost Change by Location
Note:
The Margin Impact Report is also displayed in the contextual pane on the Price Inquiry screen of the Pricing system.
Open to Buy Report
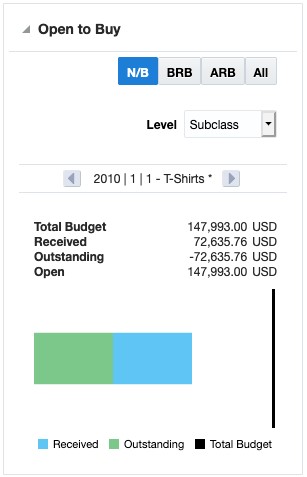
This report shows open to buy (OTB) impact for the subclasses of items on an order summarized by merchandise hierarchy. Report level filters allow the information to be viewed by order type and by different levels of the hierarchy - department, class, or subclass - in order to provide deeper insight to take decisions regarding PO approval or date changes. It displays a stacked horizontal bar graph showing the OTB budget that has already been spent for orders that were previously received or are approved but still outstanding for the period represented by the OTB EOW date on the order. The vertical line shows the OTB budget for the period.
Figure 3-4 Open to Buy Report
| Metric | Description |
|---|---|
|
Merchandise Hierarchy |
The hierarchy whose OTB budget information is being displayed is shown above the budget information. This will be either a department, class, or subclass, based on the report level filter selected. Arrows on either side of the hierarchy information allow you to scroll through the information for department (or class or subclass) on the order. |
|
Total Budget |
Indicates the total OTB budget amount (cost or retail) for the selected order type, merchandise hierarchy and the order's OTB EOW date. |
|
Received |
Indicates the OTB total budget that has been spent (cost or retail) against received orders for the order type, merchandise hierarchy, and the order's OTB EOW date. |
|
Outstanding |
Indicates the OTB total budget that has been spent (cost or retail) against open purchase orders for the order type, merchandise hierarchy, and the order's OTB EOW date. |
|
Open |
Indicates what is remaining in the budget for the order type, merchandise hierarchy, and the order's OTB EOW date. It is calculated as Total Budget - (Received + Outstanding). |
This report is displayed by default in the contextual pane of the Order workflow.
Order Shipments Report
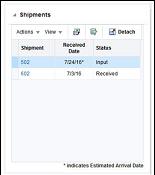
This report displays a list of all the shipments associated with a given purchase order. The shipment IDs are hyperlinks that open the Shipment screen for the given shipment for users with privileges to access that screen.
Figure 3-5 Order Shipments Report
| Metric | Description |
|---|---|
|
Shipment |
This shows the shipments associated with a purchase order. It is also hyperlinked to open the Shipment screen for the given shipment for users with the appropriate privileges. |
|
ASN |
Holds the ASN number associated with the shipment, if it exists. |
|
Received Date |
Shows the receipt date for the shipment, if it has been received, or the estimated arrival date, if it has not yet been received. An * is appended to the end of the date for estimated dates. |
|
Status |
This shows the shipment Received, Input, Cancelled, Extracted, Invoice Entered, and Unmatched. |
This report is displayed by default in the contextual pane of the Order Search page.
Order Summary Report
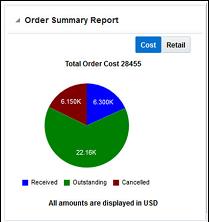
Order Summary report provides visibility to the cost and retail totals for a given order. The report is a pie chart that shows the breakout of received, outstanding and cancelled amounts for the given order. The report allows you to toggle between viewing these totals by cost or retail. The currency used will be based on the currency passed to the report by the screen in which it is displayed. By default, it will be in primary currency if no currency is passed to the report.
Figure 3-6 Order Summary Report
| Metric | Description |
|---|---|
|
Total Order Cost |
Unit cost * order quantity for all items on the order. |
|
Received Order Cost |
Unit cost * received quantity for all items on the order. |
|
Outstanding Order Cost |
Unit cost * (ordered quantity - received quantity) for all items on the order. |
|
Cancelled Order Cost |
Unit cost * cancel quantity for all items on the order |
|
Total Order Retail |
Unit retail * order quantity for all items on the order. |
|
Received Order Retail |
Unit retail * received quantity for all items on the order. |
|
Outstanding Order Retail |
Unit retail * (ordered quantity - received quantity) for all items on the order. |
|
Cancelled Order Retail |
Unit retail * cancel quantity for all items on the order |
This report is displayed by default in the contextual pane of the Order Search screen.
Transfer Parent/Diff Summary Report
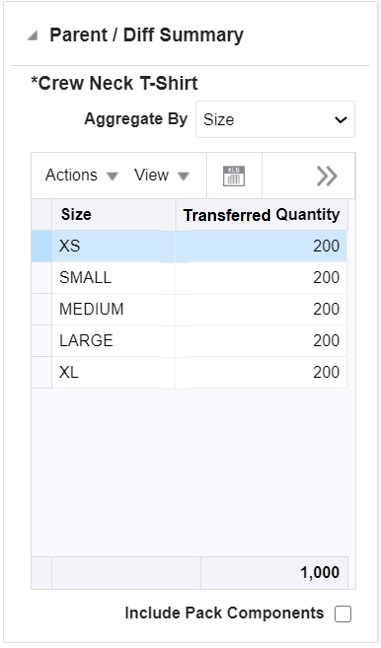
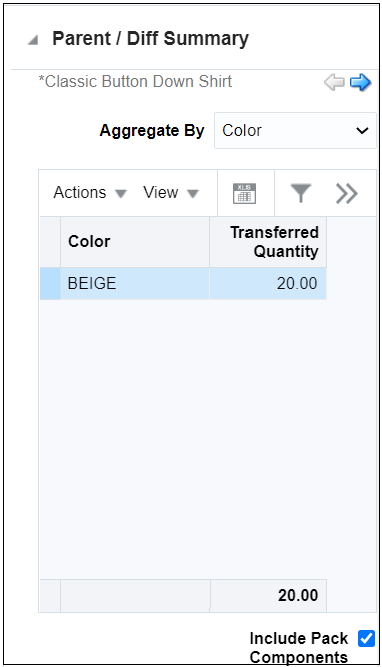
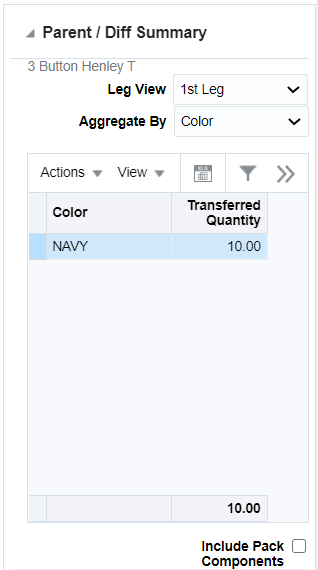
This report allows users to view a quantity summary for item parent/diff combinations on a transfer, based on an item passed into the report. If the item passed into the report is a pack item, next and previous buttons will be shown so that you can see the details for each parent item in the pack. For transfers with finishing, a user can also choose to see the information for first or second leg of the transfer. You can choose which diff type you wish to aggregate the parent item by, selecting a value in the Aggregate By filter.
Figure 3-7 Transfer Parent/Diff Summary Report
Transfer consisting of a pack item.
Figure 3-8 Transfer Parent/Diff Summary Report - Pack Item
If the transfer is multi-legged, then there is an option to select the Leg View for the report.
Figure 3-9 Transfer Parent/Diff Summary - Multi-Legged Transfer
| Metric | Description |
|---|---|
|
Diff |
The label for this column will change based on the value selected in the Aggregate By filter. The data in the column lists the differentiators for an item's parent that are on the transfer. |
|
Transferred Quantity |
This column shows the quantity that has been included in the transfer for the parent item/diff. The value is displayed in the transfer UOM. |
|
Shipped Quantity |
It shows the quantity that has been shipped for the parent item/diff. This value is also displayed in the transfer UOM. |
|
Received Quantity |
It shows the quantity received for the parent item/diff. This value is shown in the transfer UOM. |
|
Include Pack Components |
Indicates whether or not the quantities and diffs should also summarize values that are part of a pack on the transfer. If checked, pack quantities will be included. |
This report is displayed by default in the contextual pane of the Transfer Details screen.
Order Parent/Diff Summary Report
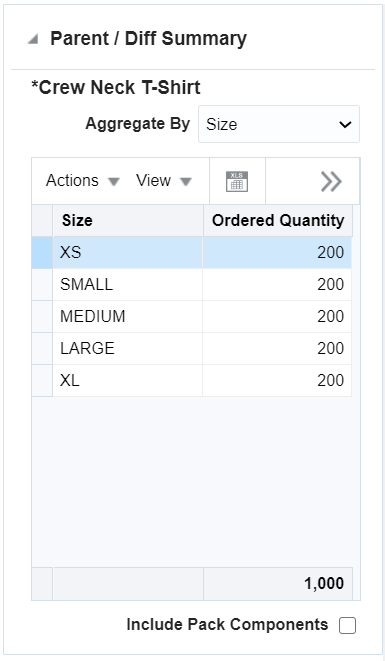
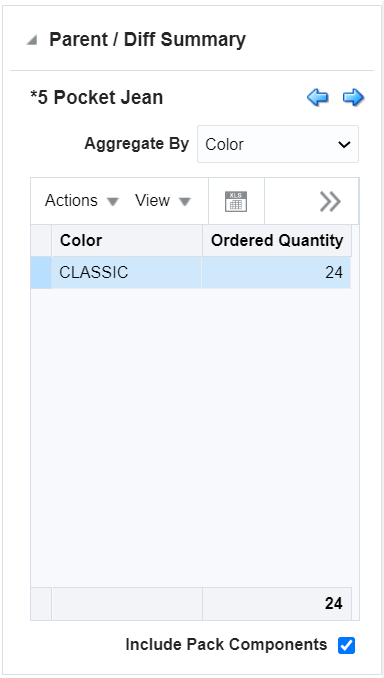
This report allows users to view a quantity summary for item parent/diff combinations on a purchase order, based on an item passed into the report. If the item passed into the report is a pack item, next and previous buttons will be shown so that you can see the details for each parent item in the pack. You can choose which diff type you wish to aggregate the parent item by, selecting a value in the Aggregate By filter.
Figure 3-10 Order Parent/Diff Summary
Order consisting of a pack item.
Figure 3-11 Order Parent/Diff Summary - Pack Item
| Metric | Description |
|---|---|
|
Diff |
The label for this column will change based on the value selected in the Aggregate By filter. The data in the column lists the differentiators for an item's parent that are on the order. |
|
Ordered Quantity |
This column shows the quantity that has been effectively included in the order. The value is shown in the unit of purchase. |
|
Received Quantity |
It shows the quantity received for the parent item/diff. This value is shown in the unit of purchase. |
|
Cancelled Quantity |
It shows the quantity cancelled for the parent item/diff. This value is shown in the unit of purchase. |
|
Include Pack Details |
Indicates whether or not the quantities and diffs should also summarize values that are part of a pack on the transfer. If checked, pack quantities will be included. |
This report is displayed by default in the contextual pane of the Order Details screen.
Projected Order Quantity Timeline Report
The Projected Order Quantity Timeline report shows the expected quantity on hand along with the expected sales for an item at a location over a given time period. The report also indicates if the item is on promotion, and if the day is a holiday.
Figure 3-12 Projected Order Quantity Timeline Report
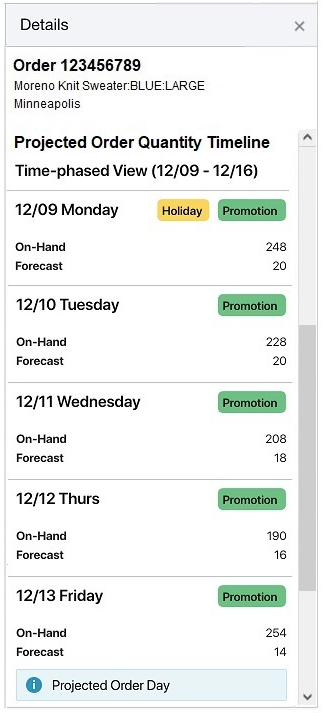
The following details are present in the tables:
Table 3-1 Timeline Report
| Metric | Description |
|---|---|
|
On Hand |
Expected quantity at the location for the item on the calendar date. |
|
On Order |
Projected quantity ordered for the item at the location on the calendar date. |
|
Forecast |
Sales forecast for the item at the location on the calendar date. |
Item Ownership Report
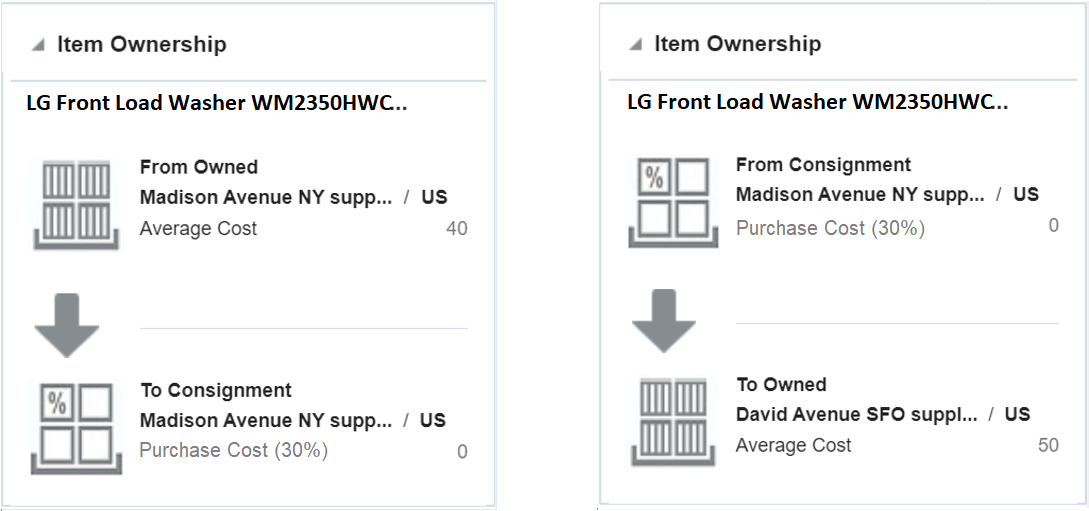
For consignment or concession items, a transfer between locations may result in a change in ownership, if the item is owned at one location and not the other. This report shows the ownership details of the item on the transfer at both sending and receiving locations. The following will be shown for both the from and to locations for the item passed to the report:
-
Ownership type (Owned, Consignment, Concession)
-
Primary supplier site
-
Primary origin country
-
Cost basis
-
For owned items, this will be either the average cost or standard cost, depending on the Cost Method system option.
-
For consignment or concession items, this will be the purchase cost from the supplier. This could be either a set cost or a purchase rate based on the retail price. If a purchase rate is used, the rate will also be displayed.
-
The currency for the cost information will be based on the currency passed into the report.
Because it is not permitted to transfer between some locations for consignment or concession items due to the ownership
change impacts, if the transfer falls in any one of the restricted transfer cases, then there will be an error icon (![]() ) displayed in the to location section.
) displayed in the to location section.
Figure 3-13 Item Ownership Report
This report is displayed by default in the contextual pane of the Transfer Details screen if the Consignment/Concession system option is checked.
Item Image Report
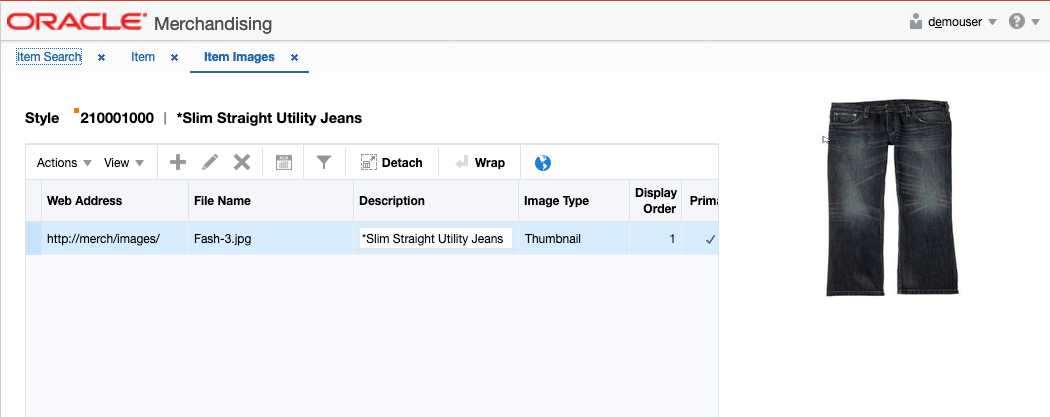
The Item Image report is available in the contextual pane on the Item Images screen. It shows the image uploaded for the item in order for you to validate the link you have added for the item.
Figure 3-14 Item Image Report
Replenishment Approval Errors Report
The Replenishment Approval Errors report displays the errors that occurred in the Approve Replenishment Orders batch (rplapprv), and is displayed in the Contextual Pane on the Order Review screen.
The Replenishment Approval Errors report is called from multiple places on the Order Review screen including the Orders page, the Summary page, and the Order Review Detail page. The errors included on the report vary based on the level from which the report is triggered.
Figure 3-15 Replenishment Approval Errors Report
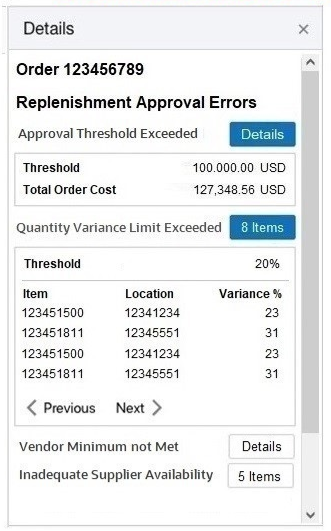
The following details are present in the tables:
Table 3-2 Error Report
| Metric | Description |
|---|---|
|
Error Message: Vendor Minimum not Met |
|
|
Order Level: |
|
|
Vendor Minimum |
Vendor Minimum value from Supplier Inventory Management. |
|
Total Order Quantity |
The total value of the order in the UOM specified for vendor minimum. |
|
Detail Table: |
|
|
Location |
The location Identifier. |
|
Name |
The name of the location |
|
Amount |
The value of the item at the location in the UOM specified for vendor minimum. |
|
Approval Threshold Exceeded |
|
|
Threshold |
The maximum order cost allowed for automatic approval. |
|
Total Order Cost |
The total cost of the order. |
|
Quantity Variance Limit Exceeded |
|
|
Threshold |
The item/location quantity variance percentage threshold. |
|
Item |
The item number. |
|
Location |
The location where the item is going. |
|
Quantity Variance |
The calculated quantity variance for the item/location. |
|
Inadequate Supplier Availability |
|
|
Item |
The item number. |
|
Order Quantity |
The ordered quantity for the item. |
|
Available |
The supplier’s declared availability for the item/date. |
Supplier Evaluation Report
In a setup where Merchandising is integrated with the Brand Compliance Cloud Service application, this report displays the data that is sent from the Supplier Evaluation (SE) module (within Brand Compliance) for the set of evaluation types configured in Merchandising. It is available in the contextual pane of the Supplier Site Maintenance UI and the Purchase Order Maintenance header UI and shows the evaluated data based on the Supplier Site that is present in the related screen. You are expected to review this data on a regular basis and take the data points into consideration for selecting an appropriate supplier while initiating any transaction. Custom validation rules can also be defined within Merchandising using the elements of this evaluated data.
Figure 3-16 Supplier Evaluation Report
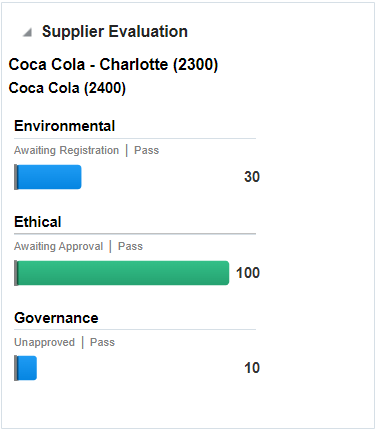
| Metric | Description |
|---|---|
|
Supplier Name |
This shows the name of the supplier along with the identifier (based on Merchandising data) related to the evaluated data being displayed. |
|
Supplier Site Name |
This shows the name of the supplier site along with the identifier (based on Merchandising data) related to the evaluated data being displayed. |
|
Evaluation Types |
This shows all the evaluation types that have been configured in Merchandising in the alphabetical order. The following types would be displayed by default, prior to the configuration -
|
|
Score |
This shows the score related to that evaluation type (as provided by the Supplier Evaluation application). |
|
Description |
This shows the description linked with that evaluation type (as provided by the Supplier Evaluation application. |
|
Status |
This shows the status related to that evaluation type (as provided by the Supplier Evaluation application). |