3 Integration Error Handling
WMS Cloud
WMS Cloud provides visibilities to errors that may occur in the integration in two screens - Input Interfaces and Output Interfaces. The Inbound Interfaces screen will provide visibility to errors that occur in the integration from Merchandising or SIOCS applications into WMS Cloud.
For data inbound to WMS Cloud, the APIs will respond back with appropriate error messages in the response if the message fails validation. These error messages can also be seen in the "Stage Record" tab of "Input Interfaces" screen as shown below which contains both failed and successful messages.
Figure 3-1 Input Interfaces

If there are issues with the data sent in the interface, appropriate changes need to be made to the data and data needs to be resent. However, if the issue is that dependent data is missing, for example, a purchase order is sent for an item that doesn't exist in WMS Cloud, then once the data is corrected the record can be reprocessed from the Input Interfaces view by selecting the appropriate record and clicking the "Reprocess selected records" button.
For data sent from WMS Cloud to Merchandising, SIOCS, and OROB, the status of the messages sent from WMS cloud can be seen in the Output Interfaces view. Like the Input Interfaces view, both successful and failed messages are visible in this screen.
Figure 3-2 Output Interfaces

If messages appear with Failed status, then the details of the errors can be viewed by clicking on the Interface Logs button, as seen below. Depending on the error, this view will also allow the message to be resent by clicking on the Resend button.
Figure 3-3 Output Interfaces – Interface Logs

Universal Service Mapper (USM)
The Universal Service Mapper (USM) can also be used to view any errors that may occur during the transfer of data.
The landing page for this mapper is the Home tab which provides the overall status of the system. It also gives the number of available mappings, total service activity count and the number of successful and failed activities.
Figure 3-4 USM Home

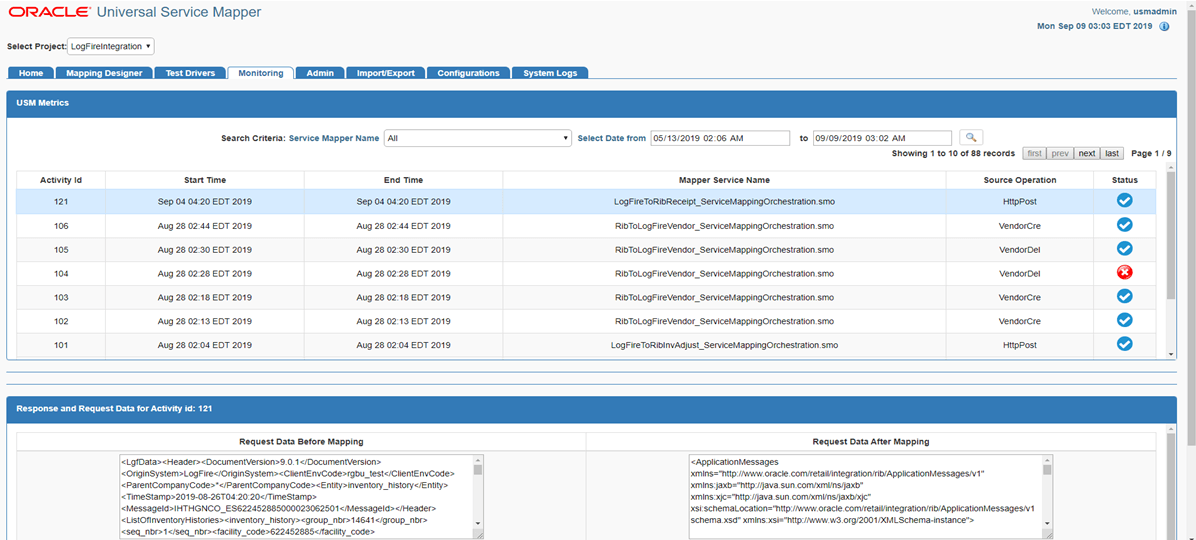
The Monitoring tab gives information on the success or failure of a particular flow, including the start and end time of the source operation and the status of the mapping operation. Based on that, you will be able to see the data before and after the mapping for the highlighted flow in the table to help with error tracking.
Note:
USM message logging is optimized to improve performance. Larger messages will be truncated to 1 MB and then saved to the database. These truncated messages show up as “before mapping” and “after mapping” on the UI.Figure 3-5 USM Monitoring

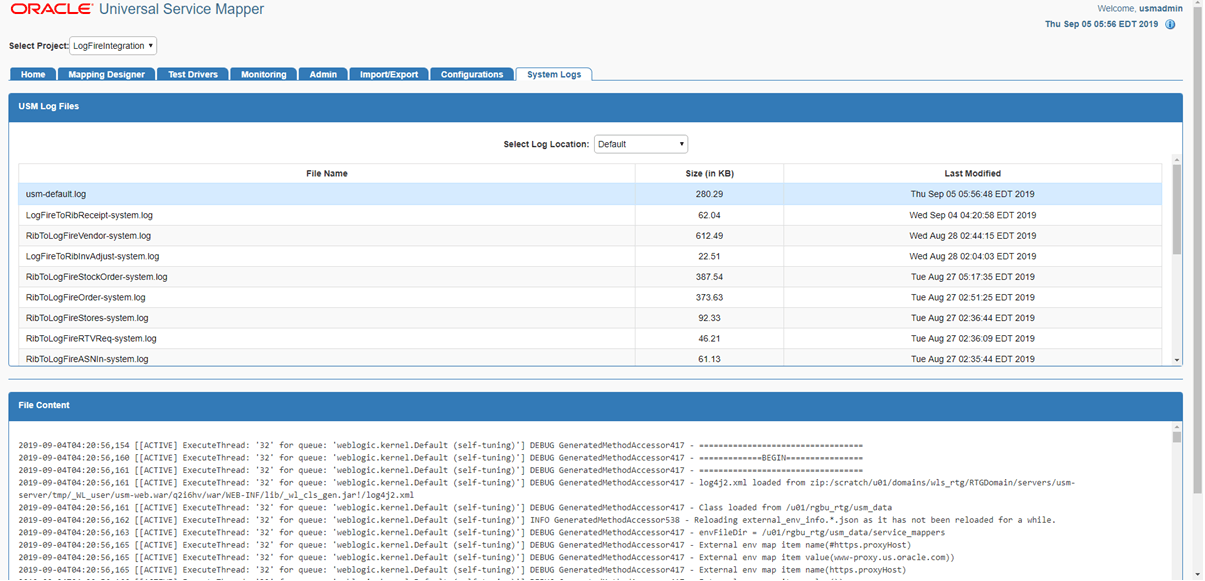
Additionally, the System Logs tab gives detailed information at an individual flow level. The status of each message can be viewed by clicking on the respective flow and viewing the corresponding logs.
Figure 3-6 USM System Logs
