Application Administration Tasks
Optionally, one or more sets of required application-specific administration tasks can be set up. These tasks are outside the scope of this document and are covered in the application-specific administration guides.
Task Status Dashboard
The Task Status Dashboard provides an interface that can be used to monitor the status of the tasks and download the log file when a task is completed. It allows the user to filter the submitted tasks by type, owner, or time. The status tiles show the percentage of tasks in that status and also act as a filter if the user clicks on them. The job name will become a hyperlink to the log file once the task is completed.
Figure 5-73 Accessing Task Status Dashboard

Description of "Figure 5-73 Accessing Task Status Dashboard"
It can be accessed from the menu by clicking Administration -> Task Status Dashboard for Planning Data Store.
The Status Dashboard displays the details of all or some administration tasks, based on the filters that are applied. Logs are available for each task.
Dashboard Columns
The following data is displayed in the dashboard.
Description
This represents the task label provided by the user. You can use this field to differentiate between the various jobs that have been submitted or scheduled. For example, application Information is a task in the Online Administration Tool. You can schedule this task to run daily and assign the task label Information Daily to it. At the same time, you can schedule the same task to run weekly and assign the task label application Information Weekly to it.
Status
This represents the status of the task. The possible status values are Success, Failure, In Progress, Scheduled, and Pending. If the task fails, a message link is also provided that shows the failure message when you hover over the status field.
Task Type
This represents the name of the task. The name is unique for the task type. All labels are pre-defined and cannot be changed by the user.
Submitted by
This represents the login name of the user who submitted the task.
Started/Scheduled
This represents the time when the submitted started. The time displayed is in the time zone of the browser.
Completed
This represents the time when the task was completed or ended. If the status of a task is either In Progress or Scheduled, then this field is left blank. The time displayed is in the time zone of the browser.
Record Status
This represents the count of rejected records. If any batch steps have records that were rejected due to a validation error, the user will be able to see the count of the rejected records. This field is used only by the tasks that load dimension or fact data. The rejected records are visible at the child level and the sub-child level. The user can select the level in the UI and click the download Rejected Record button to download the set of rejected records for that level.
Other Dashboard Options
This section describes other dashboard options.
Sorting
The task list can be sorted by any column, with the exception of the Output column, by using the Sort Ascending and Sort Descending arrows that are visible when you hover over the column header.
Filtering
The task list can be filtered by type, owner, or time, using the icons shown in Figure 5-75.
The status tiles in Figure 5-76are also filters that when clicked will cause the task list to only show tasks of that status.
Accessing Logs
If a task contains subtasks, the description column will contain a hyperlink. Click the hyperlink to open up a new view, which contains only details about that task and it subtasks, as shown in Figure 5-77.
Any subtask of a given task can contain its own subtasks; these are by default collapsed in this view. Click the arrow icon in front of a subtask to expand that subtask and show the next level of subtasks. To collapse the view, click the arrow icon again.
If the task does not have any subtasks when it executed, the Description column will not have a hyperlink, as shown in Figure 5-78.
You can also use the right click menu to access options to expand and collapse subtasks.
Select the task or subtask whose log you want to view. Click Watch live log (highlighted in Figure 5-79) to see the logs in a pop-up window that has navigation buttons. This button can be used even after the task has finished executing.
Optionally, you can download the log by clicking Download Log (highlighted in Figure 5-80). This downloads all the logs of main task and its nested subtasks, if any, in either .zip format or .txt format.
Select a task or subtask and click Download Rejected Records to download rejected records. This button is active for the tasks that have a rejected record count under the Record Status column.
You can use the Auto-Refresh toggle button, shown in Figure 5-81, to automatically refresh the Administration Dashboard.
To return to the task dashboard that has information on all the tasks, click Task Status (highlighted in Figure 5-82).
Cancel Task
Use this feature is to cancel those tasks with a status of pending or in-progress that have remained in that status for too long. Only the administration user of the logged-in solution can cancel the task.
When you select the tasks with a status of pending or in-progress that belong to the logged-insolution, the Cancel Task button/Actions menu/Context menu is enabled.
Figure 5-83 Task Status
Click Cancel Task. You see a confirmation pop-up.
Figure 5-84 Cancel Task Confirmation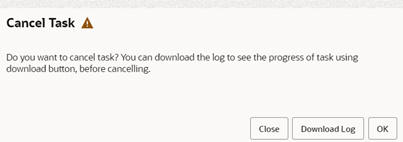
In the Confirmation popup, click Close to close the pop-up. Click Download Log to download the trace log of the task.
At this stage, after you check the logs, you can decide whether to continue with Cancel Task or not. If you have questions, you can raise an SR with the downloaded trace log to Oracle support. Click OK to send the request to cancel the task. You will see a notification message regarding the status of the request.
Figure 5-85 Cancel Message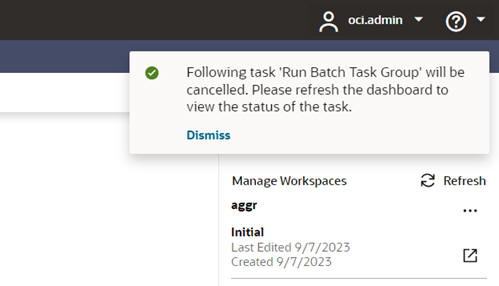
Figure 5-86 Task Status Details
The status of a task is set to failed once it has been running for 24 hours (or 86400 seconds) and the status of all its child tasks that are pending or running are set to failed too. This 86400 seconds limit can be configured using the PDS environment variable RPAS_SCRIPT_TIMEOUT. If RPAS_SCRIPT_TIMEOUT is set, the task is set to failed after running for RPAS_SCRIPT_TIMEOUT seconds. If not set, the default value of 24 hours is used. The RPAS_SCRIPT_TIMEOUT applies for all tasks.
For a workbook build via UI and OAT, the PDS environment variable RPAS_WORKBOOK_BUILD_TIMEOUT can be set. If RPAS_WORKBOOK_BUILD_TIMEOUT is set, the workbook build task fails after running for RPAS_WORKBOOK_BUILD_TIMEOUT seconds. If not set, RPAS_SCRIPT_TIMEOUT will be used. If both are not set, the default of 24 hours will be used.
Re-Run Task
This feature is used to re-run those tasks with a status of failed or cancelled. When this action is executed, the dashboard refresh will initially display the task status as pending and then in-progress. Admin and non-admin users who have logged into a solution can re-run the task. To enable this feature, the property enable.rerun.task must be set to true. The default value of this property is true. This feature is for tasks of type Workbook Build and Run Batch Task Group. Non-admin users can only re-run Workbook Build tasks. POM application can only re-run “Run Batch Task Group” tasks. Administrator can re-run both the tasks.
The OAT log of re-run tasks will display a message such as:
"2024-10-10 22:30:23|###############Task has been restarted############ Task has been restarted ############". Old logs of the Failed/Cancelled task are retained.
Figure 5-87 Re-Run Task Button Enabled

Figure 5-88 Status Notification

Figure 5-89 Updating Status

Figure 5-90 List of Subtasks

Figure 5-91 Refreshing Dashboard

Figure 5-92 Task Execution Complete

Restore Size
Administration users can resize the administration dashboard Task Status columns width. This makes it easy to read text displayed in the cells. The user can resize the column width by dragging the column header cell border using the mouse or by using the context menu option (right click on mouse). Only one column can be resized at a time. After a column is resized, when the table size is increased, the horizontal scroll bar is displayed. This change to the size is retained only for that session. After resizing a column, the user can revert the changes by clicking View menu -> Restore Size. The Restore Size option is checked when the task status table is initially loaded.
Figure 5-93 Restore Size

When the user resizes the column, this option is unchecked. When the user clicks this, changes are reverted, and the grid is refreshed to the default columns width.
Figure 5-94 Resize Restore

Active Users
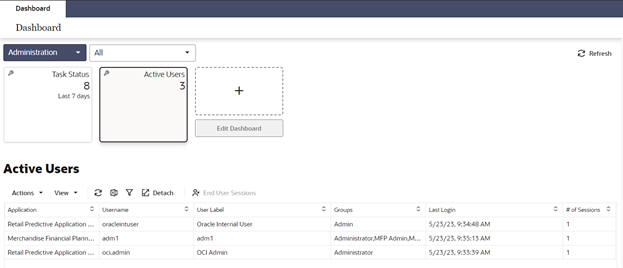
The Active Users dashboard tile, shown in Figure 5-95, provides information on all users currently accessing the application. This information can be used to determine who is currently in the system; an administrator can use this information when notifying users to log out prior to running an administrative task.
The Active Users profile lists all users currently logged into the application. For each active user, the following information is provided.
-
Logged-in user’s application name
-
Logged-in user's name
-
Logged-in user's label
-
Logged-in user's groups
-
Logged-in user's last login time
-
Number of active sessions for the user
Other Active User Options
The following Active User options are available.
Manage Columns
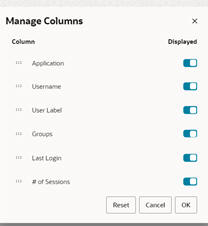
The Active Users table columns can be managed by using the View menu -> Manage Columns option or from the column header context menu -> Manage Columns option. Administrators can use Manage Columns, shown in Figure 5-96, to hide unwanted columns in the Active Users table.
Detach
The Active Users table can be detached using the toolbar Detach action, using the View menu -> Detach option, or from the column header/row context menu -> Detach option, as shown in Figure 5-97.
Sorting
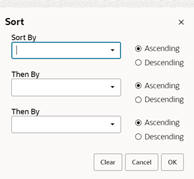
The Active Users table can be sorted by any column by using the Sort Ascending and Sort Descending arrows that are visible when you hover over the column header, as shown in Figure 5-98. The Active Users list can also be sorted by using the View menu -> Sort option or from the column header context menu -> Sort option.
Filtering
The Active Users table can be filtered by any columns. The user can also use the View menu -> Filter option or the column header/row context menu -> Filter option to obtain filtered results, as shown in Figure 5-99.
Select All
All of the Active Users table rows can be selected using the Action menu -> Select All option or using the row context menu -> Select All option, as shown in Figure 5-100.
Refresh
The Active Users table data can be reloaded using the refresh toolbar action, from the Action menu -> Refresh option, or from the column header context menu -> Refresh option, as shown in Figure 5-101.
Download Active Users
The user can download the active users' details in the format of an Excel spreadsheet using either the toolbar Download Active Users action or from the Action menu -> Download Active Users option, as shown in Figure 5-102.
End User Sessions
An administrator can end a user’s session of the same application if the user has left the session idle for long, either from the toolbar End User Sessions action, from the Action menu -> End User Sessions option, or from row context menu -> End User Sessions option. In case of a single selection in the table, this button is not enabled for current logged in user and the user of applications other than logged in application. In case of multi-selection on the table, this button is not enabled if the selection contains the current user or users of applications other than logged in application.Figure 5-103 End User Sessions

Manage Interface Run Status
The OAT task is located under Configured Batch Tasks. Use this OAT task to update the status of the given interfaces and run IDs.
Figure 5-104 Configured Batch Tasks Group
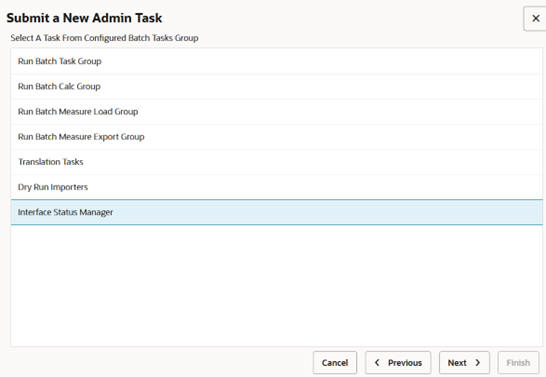
-
List Interface Status
-
Manage Interface Status
List Interface Status
From the list of options provided, select the relevant interface, as shown in the following figure. Then submit the task..
Figure 5-105 List Interface Status
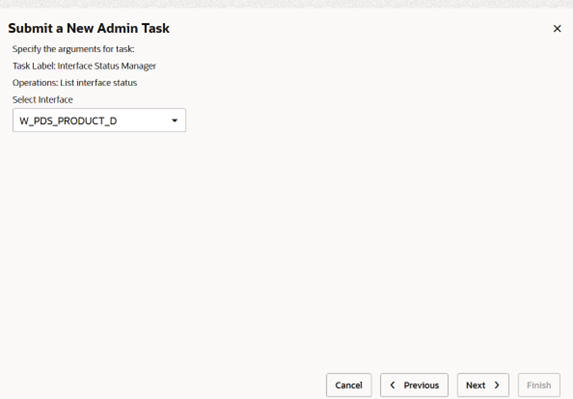
Figure 5-106 Submit Interface Status
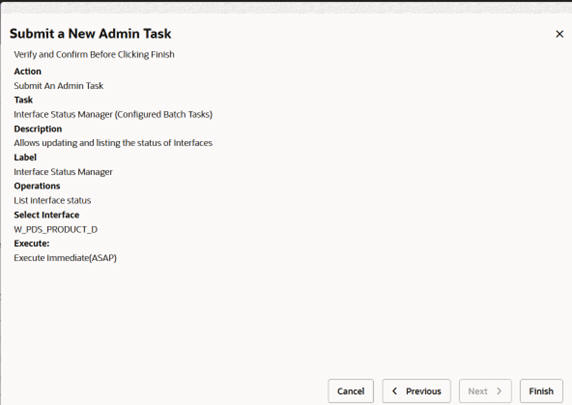
Details related to the selected interface, such as run_id, created_date,updated_date, and status can be viewed in the log after the task is successful.
Manage Interface Status
Select the interface from the list. The Run_id text field takes number values as input. If multiple run_ids are to be passed , they must be separated by commas. Select the appropriate status from the drop-down list.
Figure 5-107 Copy from Existing Admin Task

Once the inputs are provided, the task can be submitted. This will update the status of the given interface and run_ids.
Figure 5-108 Submit Existing Admin Task
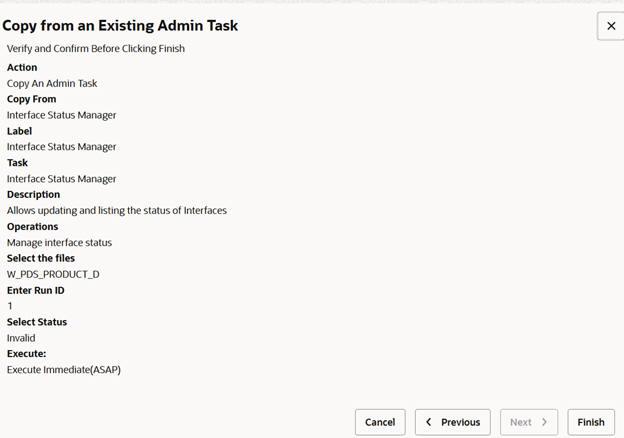
You can verify the status change by submitting the Interface Status manager task with the list option.
Dry Run Importers
Figure 5-109 Dry Run Importers
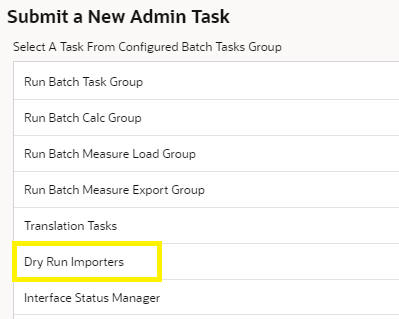
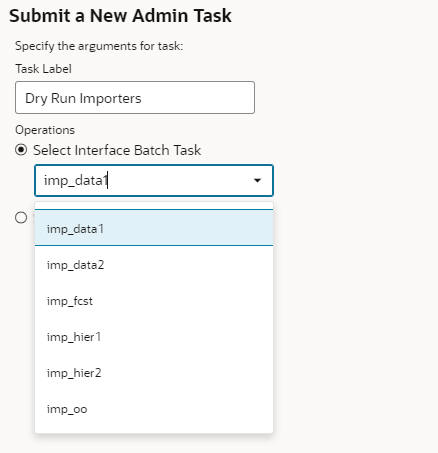
- Select Interface Batch Task
The user can select the batch tasks created for running interfaces.
Figure 5-110 Interface Batch Task
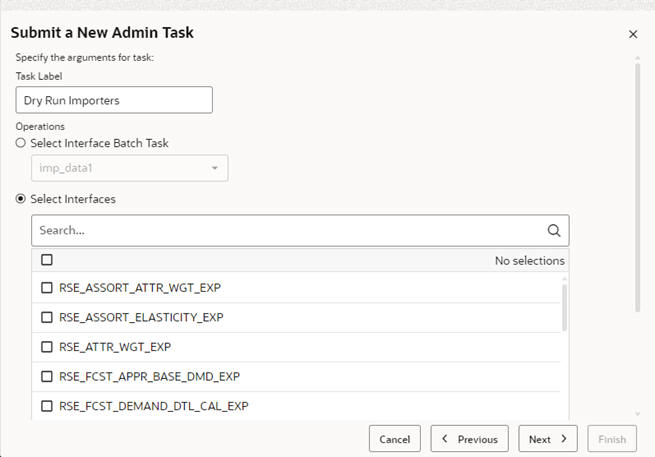
- Select Interfaces
The user can select the individual interfaces from the list.
Figure 5-111 Select Interfaces
Dry Run Importers – Hierarchies
The logs display the interface entries to be used for importing data, validation of data, list of tables that will be affected, rollup changes, fact tables that will be modified, aggregate tables that will be modified, and a summary of the report.
Dry Run Importers – Data
The logs display the interface entries to be used for importing data, the number of fact groups affected, and the number of records inserted into each fact group table.


