3 Contextual Reports
Contextual Reports are displayed in a collapsible pane of some Pricing pages to provide additional information to the user in the context of a particular workflow, to aid in decision making. The reports are considered contextual, as the data displayed in the page influences what is displayed in the report.
The contextual pane also offers opportunities for customization of the solution. See the Merchandising Customization and Extension Guide for more details on modifying the base reports displayed in the Pricing contextual panes or adding custom reports.
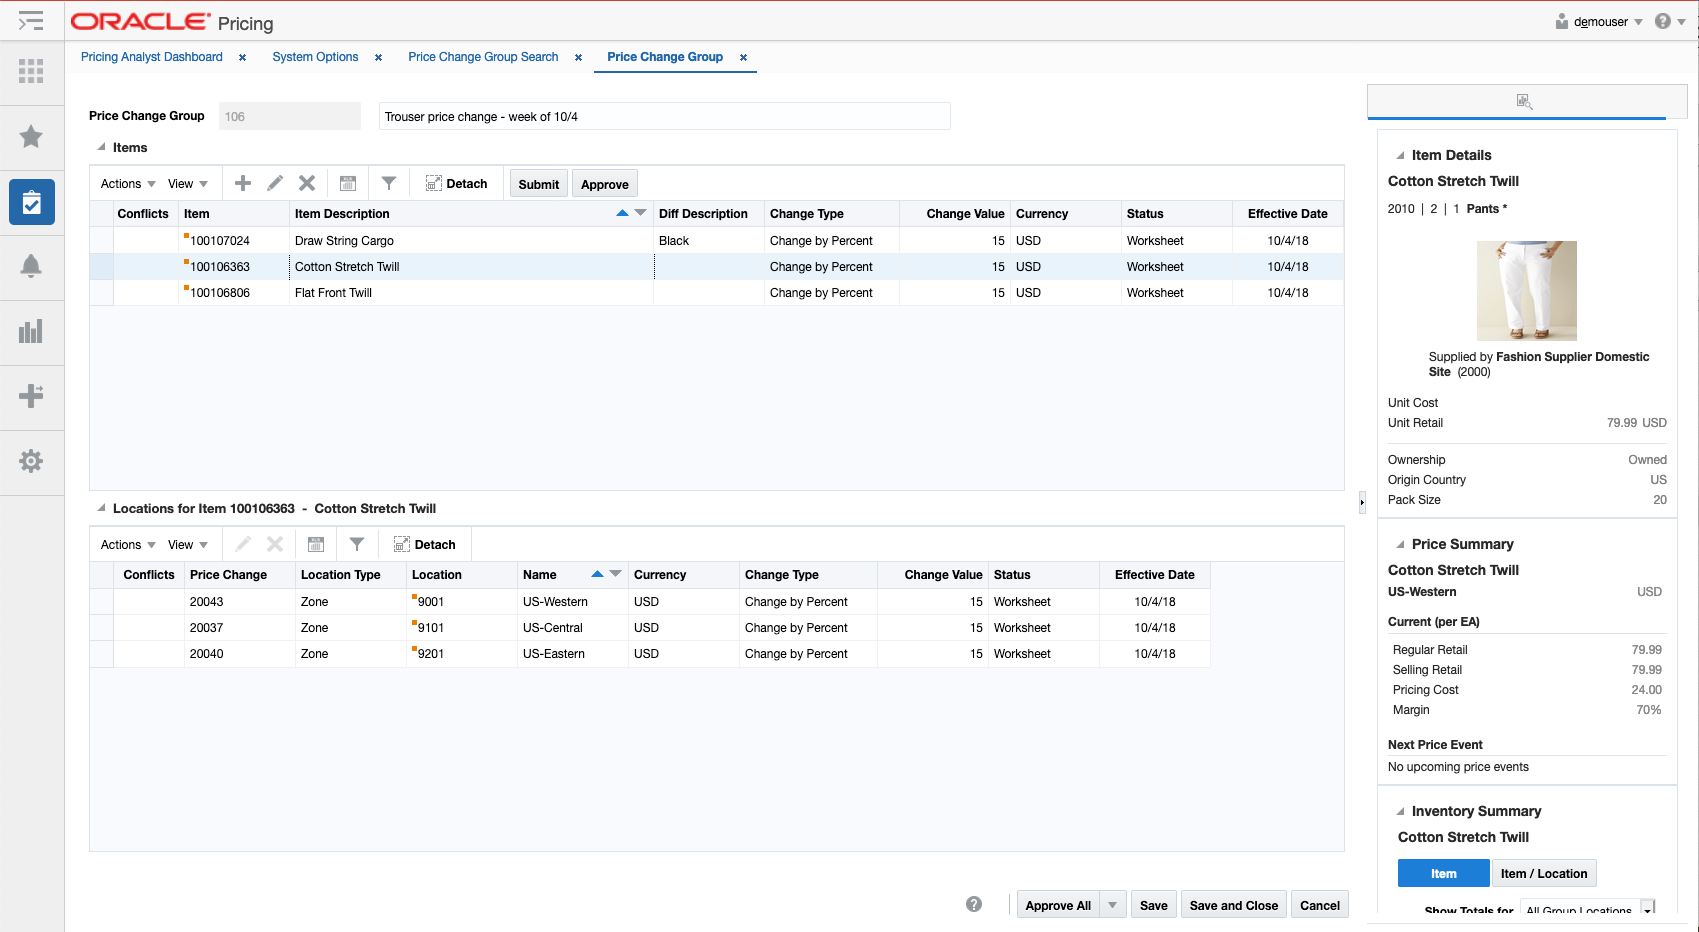
Item Details Report
Item Details report shows additional item information that may not be available in the associated screen, such as merchandise hierarchy, supplier, cost and retail, country and pack size. For Pricing, this report does not consider location, so all details are at the item level. This report is displayed by default in multiple screens in Pricing.
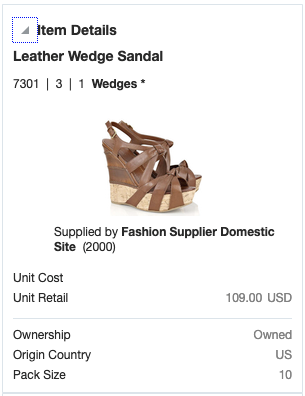
| Metric | Description |
|---|---|
|
Item Description |
Shows the description of the item. |
|
Merchandise Hierarchy |
Shows the ID of the department, class and subclass to which the item in the report belongs followed by subclass name. |
|
Item Image |
Shows the primary image associated with item, if available. If an image does not exist, then the default item image defined as a Merchandising system option will be used. |
|
Supplier Site |
Shows the name and ID of the primary supplier site for the item. |
|
Unit Cost |
Displays the unit cost of the item at the primary supplier. If the cost unit of measure is not EA, then it also displays the UOM (for example, 2.00 USD per KG). The currency used for the cost will be the primary currency. |
|
Unit Retail |
Displays the current selling retail of the item in standard unit of measure based on a location in the base zone, in primary currency. If the item is currently on clearance, then a price tag icon ( |
|
VPN |
Displays the VPN for the item associated with the supplier site, if available |
|
Ownership |
Indicates if the item is owned, consignment, or concession when purchasing from the supplier and country shown in the report. |
|
Origin Country |
Displays the ID of the primary country of origin associated with the item and the supplier site. |
|
Pack Size |
Displays the pack size of the item at the primary supplier site/origin country. |
Displayed by default in the following Pricing screens:
-
Price Change Group
-
Clearance Group
-
Conflicts
Price Summary Report
The Price Summary Report shows a summary of the current and future pricing activity for an item/location combination. The location could be a single store or warehouse, or a zone.
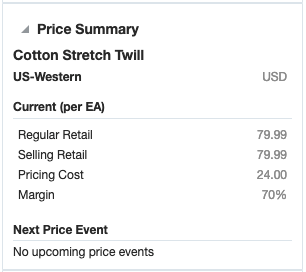
| Metric | Description |
|---|---|
|
Item Description |
Shows the description of the item. |
|
Location Description |
Shows the description of the location for which the item's details are displayed. |
|
Location Currency |
Shows the currency of the location, which is how the cost and price information in the report will be displayed. |
|
Current (per UOM) |
The unit of measure for the price and cost information in the report is shown in the label heading. It will be the selling unit of measure for the item/location combination. If more than one selling UOM exists, then this will be blank and no price and cost information will be displayed either. |
|
Current - Regular Retail |
Indicates the regular price in the selling unit of measure. If the location is a zone, the price will be averaged across locations in the zone. |
|
Current - Selling Retail |
Indicates the selling price in the selling unit of measure. If this is different than the regular retail, it indicates the item is currently on clearance. If the location is a zone, the price will be averaged across locations in the zone. |
|
Current - Pricing Cost |
Indicates the current pricing cost for the item/location. The pricing cost is calculated as the primary supplier/country unit cost for the item/location plus estimated landed cost (ELC), minus any off-invoice deals. If the location is a zone, the cost will be averaged across locations in the zone. It is displayed in terms of the selling unit of measure. If a pricing cost is not available, then the primary supplier/country cost is used. |
|
Current - Margin |
The current margin percentage calculated as: For markup based on cost: (Selling Retail - Pricing Cost)/Pricing Cost * 100 For markup based on retail: (Selling Retail - Pricing Cost)/Selling Retail * 100 |
|
Next Price Event |
Contains information about the next pricing event approved for the item location. This includes the type of event (price change, markdown, or reset), event ID, description, effective date, and new retail. If no future approved events exist, this section of the report will read "No upcoming price events". |
Displayed by default in the following Pricing screens:
-
Price Change Group
-
Clearance Group
-
Price Inquiry
Inventory Summary Report
This report shows the inventory information for the item or item location broken out by current on hand, in transit, and on order in a pie chart. It is intended to give the pricing analyst an idea of the size of the markdown or markup that will occur based on current and expected inventory for an item/location on a price event. Report level toggles allow the pricing analyst to view the information for an item or an item/location. If viewing for an item, the pricing analyst can choose to see information for all locations in the group, or only the stores or only the warehousesFoot 1. Similarly, if viewing at item/location level, the pricing analyst can choose to view all locations in a zone or only the stores/warehouses.
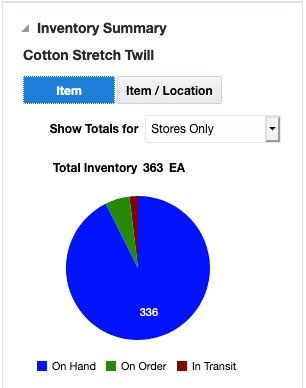
| Metric | Description |
|---|---|
|
Item Description |
Shows the description of the item. |
|
Total Inventory |
Shows the total inventory for the item or item/location passed to the report, based on the toggles selected, in standard unit of measure. When the Item toggle is selected, the Show Totals for options include: All Group Locations, Stores Only, Warehouses Only. When the Item / Location toggle is selected, the Show Totals for options include: Selected Zone, Stores Only, Warehouses Only, Selected Store, or Selected Warehouse. It is calculated as On Hand + On Order + In Transit |
|
Pie Chart |
Shows the total inventory broken out into on hand, on order, and in transit. These are calculated as:
|
Displayed by default in the following Pricing screens:
-
Price Change Group
-
Clearance Group
Conflict Details Group
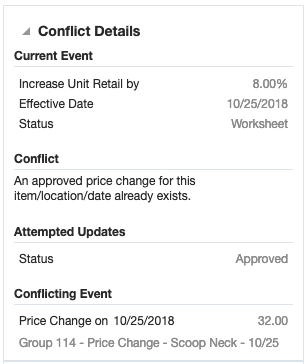
Displayed in the Conflicts screen, this report shows additional detail to the pricing analyst when reviewing conflicts found for a price change, clearance markdown, or clearance reset.
| Metric | Description |
|---|---|
|
Current Event |
The current event section of this report shows the current values on the event for the item/location passed to the report. If you use multiple units of measure for pricing, then the label for this section will include the unit of measure for the event. For example, Current Event (per EA). For the current event, original values prior to the attempted updates are displayed for the following:
|
|
Conflict |
A description of the conflict that occurred for the item/location passed to the report |
|
Attempted Updates |
This section of the report shows what the pricing analyst was trying to do when the conflict occurred. It will show the attribute of the event being changed and what the value it was being changed to. Often this will be the status, but for an already approved event, it could also be the change type and/or value, multi-unit retail, effective date, or rounding rule. |
|
Conflicting Event |
This section shows information about the event in conflict with the event the pricing analyst is reviewing. This includes the type of event, its effective date, and the group ID and description. |
Displayed by default in the following Pricing screens:
-
Conflicts
Margin Impact Report
Margin Impact report provides additional information about item margin based on cost change and price change events. The report shows the cost, retail and margin values for cost and retail change events as they relate to the date passed to the report. The blue line plots the cost change events for a time period based on the Margin Impact Month Range report system option in Merchandising, relating to the date passed to the report from the associated screen. The red line plots similar points, but for retail price changes.
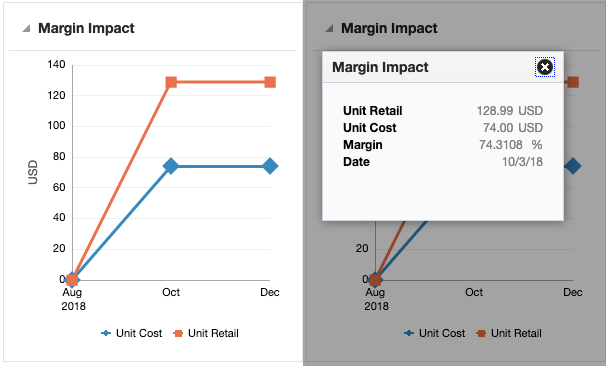
Clicking on plotted points on the graph will display a popup with the specific details for that point on the graph.
| Metric | Description |
|---|---|
|
Date |
Displays the event date when a cost change or price change is occurring or will occur in the future. |
|
Unit Cost |
Displays the cost retrieved from the future cost table for the date. If that is not available, then the current cost for the primary supplier/ country for the item/location is shown in local currency. In the case of a parent item, the average unit cost across the children for the given date is displayed. |
|
Unit Retail |
For each cost event plotted, the unit retail of the item/location on the date will also be plotted in local currency. In the case of a parent item, the average unit retail across the children for the given date is displayed. |
|
Margin |
The margin of the item is computed based on the cost/price identified for date and the markup calculation type of the item's department. For retail: Margin% = (Unit Retail - Unit Cost) / Unit Retail * 100 For cost: Margin% = (Unit Retail - Unit Cost) / Unit Cost * 100 |
Displayed by default in the following Pricing screens:
-
Price Inquiry
Note:
This report is also displayed in the Cost Change by Item and Cost Change by Location workflows in Merchandising.
Promotions Report
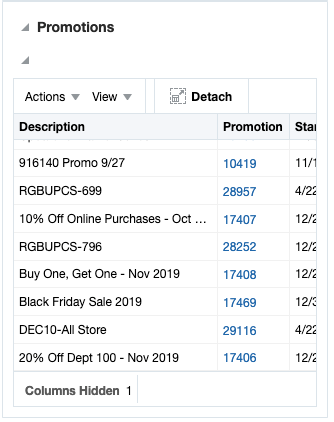
This report will display promotions, in a tabular format, for an item/location passed to the report that are active on the dates passed to the report. This could be a single date or a range of dates, as in the Price Inquiry, where the report is displayed by default.
| Metric | Description |
|---|---|
|
Promotion Description |
The description of a promotion that contains the item/location. |
|
Promotion ID |
The ID for the promotion; this is also a hyperlink which allows the pricing analyst to launch into the Promotion workflow for the promotion in view or edit, depending on privileges. |
|
Start Date |
The earliest start date for an offer in the promotion. |
|
End Date |
The latest end date for an offer in the promotion. |
Displayed by default in the following Pricing screens:
-
Price Inquiry
Footnote Legend
Footnote 1:The warehouse options in this report are only displayed if the Recognize Warehouses as Locations system option is Yes.