2 Dashboards and Reports
Dashboard reports are role-based and can be configured to be the first screen displayed to you upon opening Pricing, based on role. They are intended to highlight actionable or frequently monitored activities. Actions taken from dashboard reports are executed seamlessly or launch into a Pricing workflow, passing parameters to facilitate further investigation. Pricing has two dashboards that are provided out of the box, each with a predefined set of reports. These reports provide a point of view on the information that is relevant to that particular role in your organization. But, because you may organize your users in a different manner, there is flexibility to change which reports are displayed on which dashboards, and also to add custom reports, if desired. For more information on making these changes see the Merchandising Customization and Extensions Guide.
Some dashboard reports can be configured by threshold values. These options can be defined in the System Options screen in Pricing. See the Pricing Implementation Guide for more about these configurations.
Filtering Dashboard Reports
Each dashboard in Pricing has a number of filters such as department, location, chain etc. that can be used to narrow down the information shown in the reports on that dashboard. These filters differ by dashboard and every dashboard has at least one mandatory filter where criteria value needs to be specified to populate reports. You can use these filters to configure the data displayed in your dashboard to be specific to your area of responsibility. The criteria can be provided either in Basic or Advanced mode, depending on the requirement. Basic is the default mode when the dashboard is entered. Click Advanced to access the filters panel in advanced mode where additional criteria can be specified. You can return to Basic mode by clicking Basic in the Filters section of the dashboard.
Basic Search Criteria
To filter the dashboard reports through the basic search criteria:
-
Enter, select or search default filter criteria in the Filters pane in basic mode.
Figure 2-1 Filters Section in Basic Search Criteria

-
You can also click on the Saved Search drop down button to select one of the saved sets of filter criteria. Selecting a saved search will populate filters with saved filter criteria. If the saved search is selected to run automatically then the search will be executed too. You can also choose to manage and personalize saved searches by clicking Personalize in the list which opens the Personalize Saved Searches window. For more information on personalized saved searches, see the section Personalize Saved Search.
-
Click Search. The data that matches the filter criteria is displayed in the dashboard reports.
-
Click Reset to remove the specified filter criteria.
-
Click the Save.. button to save the current set of filter criteria as a Saved Search. The Create Saved Search window appears. For information on the Create Saved Search window, see the section Create Saved Search.
Advanced Search Criteria
To filter the dashboard reports through advanced search criteria:
-
Enter, select or search the filter criteria in the Filters pane in advanced mode.
Figure 2-2 Filters Section in Advanced Search Criteria

-
You can also click on the Saved Search drop down button to select one of the saved sets of filter criteria. Selecting a saved search will populate filters with saved filter criteria. If the saved search is selected to run automatically then the search will be executed too. You can also choose to manage and personalize the saved searches by clicking Personalize in the list which opens the Personalize Saved Searches window. For more information on personalize saved searches, see the section Personalize Saved Search.
-
Click Search. The data that matches the filter criteria is displayed in the dashboard reports.
-
Click Reset to remove the specified filter criteria.
-
Click the Save.. button to save the current set of search filter criteria as a Saved Search. The Create Saved Search window appears. For information on the Create Saved Search window, see the section Create Saved Search.
-
Click Add Fields to add more filter criteria. To remove the field from the filter, click the x right next to the field.
-
Click Reorder to change the order of the available fields. The Reorder Search Fields window appears.
-
Select the desired field and use the up and down arrows to rearrange the order of the fields.
-
Click OK to confirm the new order of the fields and close the window.
-
Click Cancel to reject any changes and close the window.
-
Personalize Saved Search
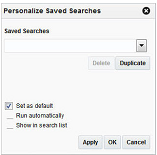
Select Personalize from the Saved Search list to view the personalized saved searches. The Personalize Saved Searches pop up allows you to edit, copy, or delete saved search criteria set.
Figure 2-3 Personalize Saved Searches
Create Saved Search
You can save a set of search criteria by clicking the Save.. button in the Filters panel after you have entered the criteria for your search. The Save button will call up the Create Saved Search window where the search criteria set is given a name and the user determines whether it should be the default search as well as whether it should be run automatically.
To view the created saved search:
-
Click the Save.. button. The Create Saved Search window appears.
Figure 2-4 Create Saved Search

-
Enter the name of the search.
-
You can also choose to save the combination of the search criteria by selecting the following check boxes:
-
Set as default
-
Run automatically
-
Pricing Analyst
This dashboard is intended to highlight to a pricing analyst pricing events that require attention. This may be because it is due to go into effect in the next few days, it is an emergency price change, or it has conflicts.
Clearances Pending Approval Report
The Clearances Pending Approval report is intended to provide the pricing analyst with a view to unapproved clearance markdowns or resets that have an effective date in the next week or over the next four weeks, based a report level toggle.

Dashboard Filters
All dashboard-level filters are applicable to this report and the clearance groups shown in the report will be associated with the filter criteria specified.
Report Details
The report consists of a tile shown at the top of the dashboard, a bar chart, and a table.
Tile
The tile for this report shows a count of clearance markdowns and resets that are not yet approved but have an effective date in the next four weeks, based on the dashboard filter criteria. Both worksheet and submitted clearance events are considered. It also displays a bar chart that shows how the markdowns and resetsFoot 1 are distributed over those four weeks. Any weeks that have emergency markdowns or resets will be shown in red.
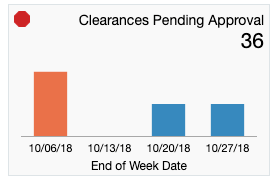
The color of the tile changes colors to reflect the severity issues represented by unapproved markdowns and resets. The rules for this are defined in the table below.
| Tile Color | Rule |
|---|---|
|
Green |
There are no emergency markdowns or resets and The total count of markdowns and resets is less than the Critical Count of Unapproved Clearances report option. |
|
Yellow |
At least one emergency markdown or reset or There are more markdowns and resets needing approval than the Critical Count of Unapproved Clearances report option. |
|
Red |
At least one emergency markdown or reset and There are more markdowns and resets needing approval than the Critical Count of Unapproved Clearances report option. |
Bar Chart and Table
The stacked bar chart has two views - one which shows the markdowns and resets needing approval, by day, for today and the next 6 days, and one where it shows these events for the next four weeks. In both cases, the charts shows the count of markdowns and resets that have effective dates in a time period, differentiated by whether it is a markdown with conflicts, markdown without conflicts, reset with conflicts, or reset without conflicts. Clicking on a bar in the chart will refresh the data in the table based on the time period selected. The first day or first week is selected by default in the chart.
The table shows a summary of the clearance groups that have markdowns or resets in the selected time period from the bar chart. The details available in the table for each group include:
| Tile Color | Rule |
|---|---|
|
Conflict |
Displays a conflict icon ( |
|
Clearance Group |
Indicates the group that contains the markdowns and resets that require approval. This ID is a hyperlink that will take the pricing analyst to the Clearance Group page to view the details of the markdowns and resets and act to approve them or update dates. |
|
Description |
The description of the group. |
|
Markdowns with Conflicts |
The count of markdowns in the group that are not approved and have conflicts. |
|
Markdowns without Conflicts |
The count of markdowns in the group that are not approved, but don't have conflicts. |
|
Resets with Conflicts |
The count of resets in the group that are not approved and have conflicts. |
|
Resets without Conflicts |
The count of resets in the group that are not approved, but don't have conflicts. |
|
Earliest Effective Date |
The earliest effective date for a markdown or reset in the group that requires approval. |
Report Actions
-
Edit Clearance Group - Selecting this option from the Actions menu, or clicking on the clearance group hyperlink, will take the pricing analyst to the Clearance Group page where they can approve or update the markdowns and resets, based on privileges.
-
Review Conflicts - Selecting this option from the Actions menu, or clicking on the conflict icon in the table, will take the pricing analyst to the Conflicts screen for more details on the conflicts contained in the clearance group.
Price Changes Pending Approval Report
The Price Changes Pending Approval report is intended to provide the pricing analyst with a view to unapproved price changes that have an effective date in the next week or over the next four weeks, based a report level toggle.

Dashboard Filters
All dashboard-level filters are applicable to this report and the price change groups shown in the report will be associated with the filter criteria specified.
Report Details
The report consists of a tile shown at the top of the dashboard, a bar chart, and a table.
Tile
The tile for this report shows a count of price changes that are not yet approved but have an effective date in the next four weeks, based on the dashboard filter criteria. Both worksheet and submitted events are considered. It also displays a bar chart that shows how the price changes are distributed over those four weeks. Any weeks that have emergency price changesFoot 2 will be shown in red.
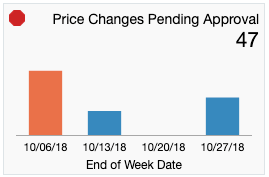
The color of the tile changes colors to reflect the severity issues represented by unapproved price changes. The rules for this are defined in the table below.
| Tile Color | Rule |
|---|---|
|
Green |
There are no emergency price changes and The total count of price changes is less than the Critical Count of Unapproved Price Changes report option. |
|
Yellow |
At least one emergency price changes or More there are more price changes needing approval than the Critical Count of Unapproved Price Changes report option. |
|
Red |
At least one emergency price changes and More there are more price changes needing approval than the Critical Count of Unapproved Price Changes report option. |
Bar Chart and Table
The stacked bar chart has two views - one which shows the price changes needing approval, by day, for today and the next 6 days, and one where it shows these events for the next four weeks. In both cases, the charts shows the count of price changes that have effective dates in the time period, differentiated by whether it is a price changes with conflicts or a price changes without conflicts. Clicking on a bar in the chart will refresh the data in the table based on the time period selected. The first day or first week is selected by default in the chart.
The table shows a summary of the price change groups that have price changes in the selected time period from the bar chart. The details available in the table for each group include:
| Tile Color | Rule |
|---|---|
|
Conflict |
Displays a conflict icon ( |
|
Price Change Group |
Indicates the group that contains the price changes that require approval. This ID is a hyperlink that will take the pricing analyst to the Price Change Group page to view the details of the price changes and act to approve them or update dates. |
|
Description |
The description of the group. |
|
Price Changes with Conflicts |
The count of price changes in the group that are not approved and have conflicts. |
|
Price Changes without Conflicts |
The count of price changes in the group that are not approved, but don't have conflicts. |
|
Earliest Effective Date |
The earliest effective date for a price change in the group that requires approval. |
Report Actions
-
Edit Price Change - Selecting this option from the Actions menu, or clicking on the price change group hyperlink, will take the pricing analyst to the Price Change Group page where they can approve or update the price changes, based on privileges.
-
Review Conflicts - Selecting this option from the Actions menu, or clicking on the conflict icon in the table, will take the pricing analyst to the Conflicts screen for more details on the conflicts contained in the price change group.
Promotion Planner
This dashboard displays to a promotion planner details about upcoming promotional offers for their area of responsibility, as determined by the dashboard filters.
Upcoming Offers Report
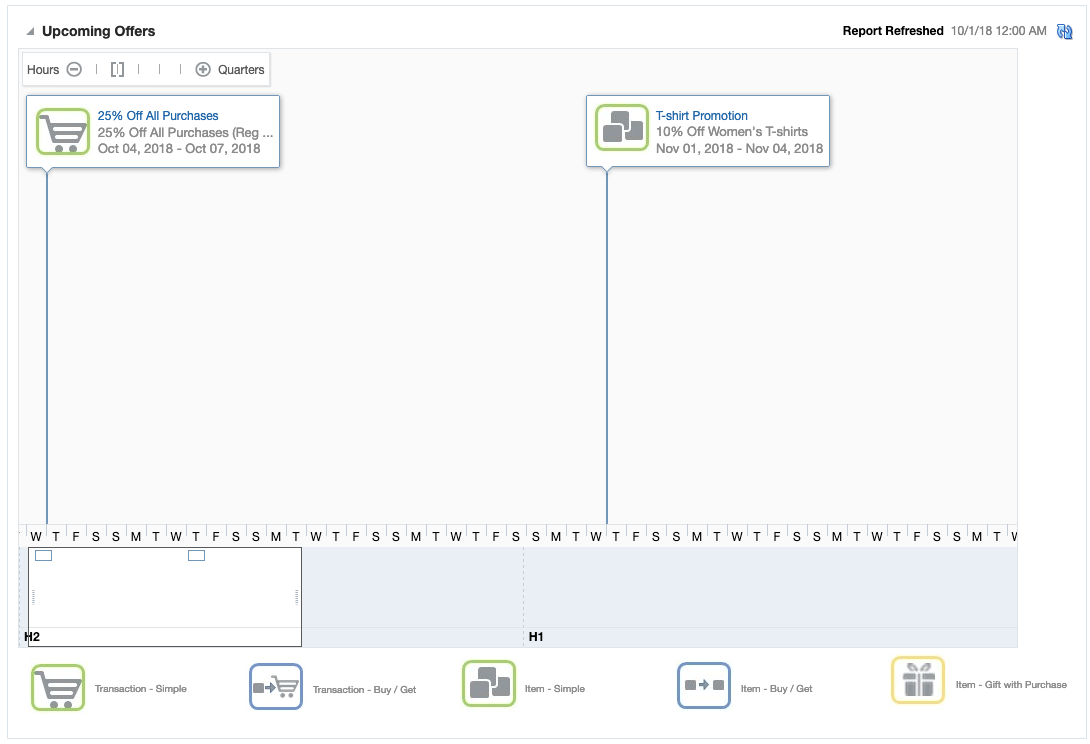
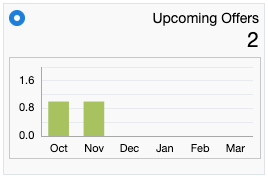
The Upcoming Offers report is a timeline view of promotional offers that will occur in the next 6 months, based on the entered filter criteria. It is intended to help the promotional planner visually see where there may be too many or too few offers in effect for a given period.
Dashboard Filters
All dashboard-level filters are applicable to this report and the promotional offers shown in the report will be associated with the filter criteria specified.
Report Details
The report consists of a tile shown at the top of the dashboard and a timeline.
Tile
The tile for this report shows a count of promotional offers that are scheduled to start in the next six months. It also displays a bar chart that shows how the offers are distributed over those six months.
Timeline
The timeline portion of the report shows the offers spread out over a timeline that covers the next 6 months. A zoom feature on the report allows the promotional planner to zoom in to see offers by a granular of a time period as by hour, or zoom out as far as by quarter. The default view will be by day.
For each offer included in the timeline, the name of the promotion and the offer will be displayed, as well as the start and end dates for the offer. The promotion name will be a hyperlink that allows the promotional planner to launch into the promotion to view or edit the details of the offers. Additionally, an icon will show the type offer: Transaction - Simple, Transaction - Buy/Get, Item - Simple, Item - Buy/Get, or Item - Gift with Purchase.
A promotional planner can navigate along the timeline by using the slider at the bottom of the chart, or the arrows on the sides of the chart to navigate. The slider section indicates what is currently being viewed and will also show a very zoomed out view of the offers over the full 6-month period.
Footnote Legend
Footnote 1:An emergency markdown or reset is one that is scheduled to go into effect less than Price Event Processing days from the current business date.
Footnote 2:
An emergency price change is one that is scheduled to go into effect less than Price Event Processing days from the current business date.