Viewing KPIs
To view a KPI chart or table, open the KPI Dashboard page by clicking a tile or the View KPI Dashboard link within the dashboard, or by selecting the Workspace/KPI Dashboard option from the Tasks menu. The full chart or table is presented beneath your dashboard tiles. Clicking another tile will refresh the page to show the chart or table for that KPI.
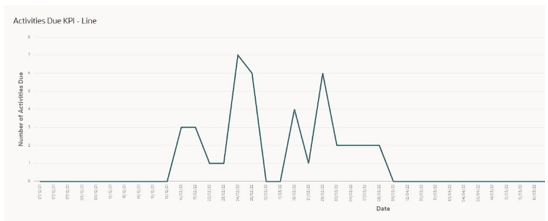
Chart KPIs are presented as bar chart or line chart, with the KPI value as the y-axis and the x-axis being the time interval.
Figure 5-7 Chart KPI

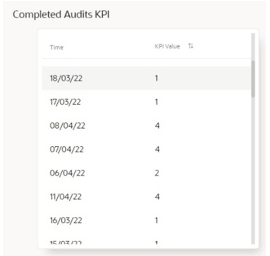
Tabular KPIs are presented as a scrollable list, with a sort option on the y-axis KPI value column only.
Figure 5-8 Chart KPI
