9 Reports
About this Chapter
This chapter contains the following sections:
-
For information on starting the Reports function, see Accessing and Running Oracle Retail Xstore Office Cloud Service Reports.
-
For a list of reports, see Available Reports By Category
Where To Look For More Information
A system configuration allows you to turn off and on any of the valid file format types available to be used when viewing/saving reports. You can also select the default format to be selected from the list of enabled file formats.
For instructions on specifying the report formats to be available to the user, see System Management, section Reports Category.
Accessing and Running Oracle Retail Xstore Office Cloud Service Reports
Note:
Only reports the user has privileges to access (based on the user's role) will be available.
-
From the Oracle Retail Xstore Office Cloud Service menu select Reports - Reporting category option (Flash Sales Summary or All Reports), or from the Reports panel, click the Flash Sales Summary link or the Daily Sales & Cash Report link.
-
If you selected the All Reports link, use the report tree structure to select the specific report, then continue with step 2 below.
-
If you selected the Flash Sales Summary link or the Daily Sales & Cash Report link, the specific report parameters page displays. Continue with step 2 below.
-
If you selected the Electronic Journal link in the Reports panel, refer to Electronic Journal for more information.
-
-
Enter the report parameters to be used to run the report.
Note:
The report parameters are the same options that are available when running the identical report within Oracle Retail Xstore Point-of-Service POS, and are specific to each report.
Refer to the Oracle Retail Xstore Point-of-Service Reports Guide for detailed information about the standard reports available in Oracle Retail Xstore Office Cloud Service.
-
In addition to the reporting parameters, specify an output type:
Note:
The output types available here are configured in Oracle Retail Xstore Office Cloud Service Settings. See System Management, Reports Category.
-
PDF - Portable Document Format
-
HTML - HyperText Markup Language (The predominant markup language for web pages.)
-
XLS - MS Excel
-
XLSX - MS Excel 2007 or newer
-
PPTX - MS PowerPoint
-
RTF - Rich Text Format
-
DOCX - MS Word
Note:
Known Firefox Limitations
XLSX, PPTX, and DOCX output types may not open properly in FireFox. The work-around for this is as follows:
-
Right-click on the Click To Download Report link.
-
Select save as... and save the report to the local file system.
-
Open the report outside of the browser.
-
-
-
Click Run Report to create the report. The report will be displayed in the format you selected, or you may need to click the Download link ( ) when applicable.
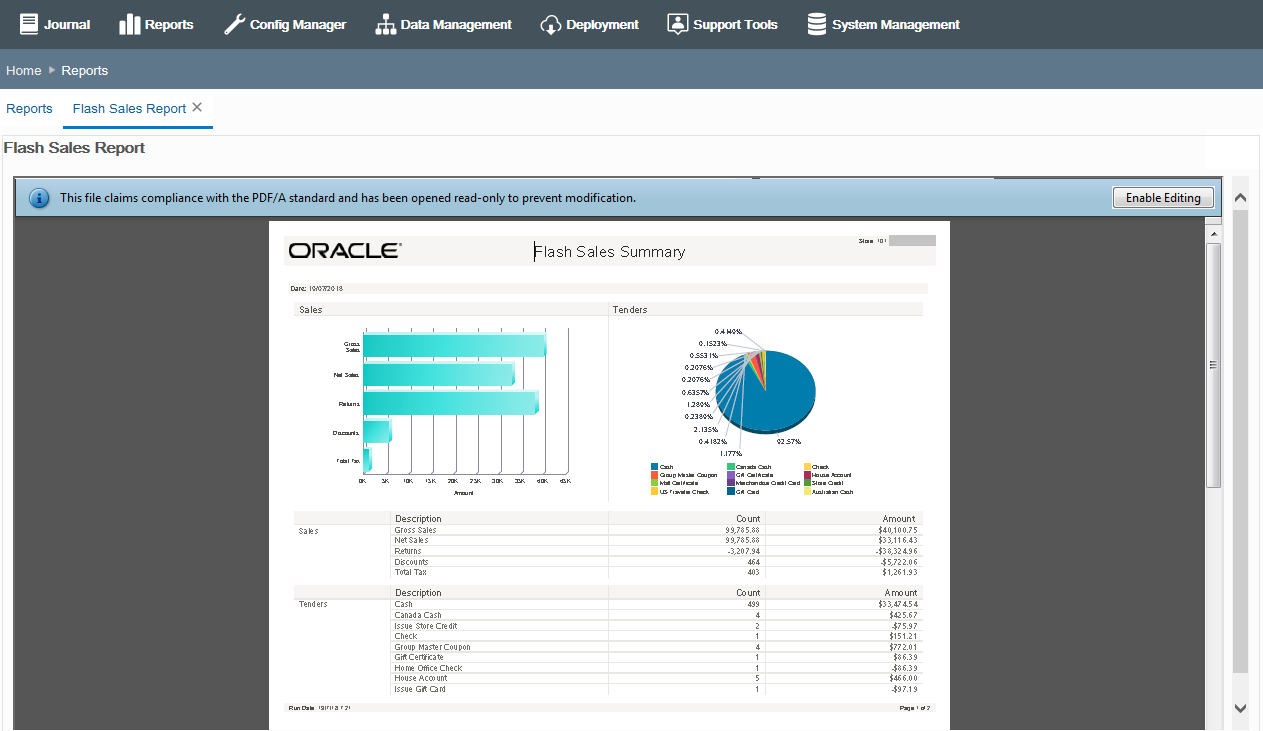
Report Example
Figure 9-1 Flash Sales Report Example - PDF Format
-
To close the report, click the close icon on the tab.
-
To return to the report parameters, click the Reports tab.
Available Reports By Category
The following reports are available in base Oracle Retail Xstore Office Cloud Service. Refer to the Oracle Retail Xstore Point-of-Service Reports Guide for detailed information about these reports.
Figure 9-2 Report Tree Structure
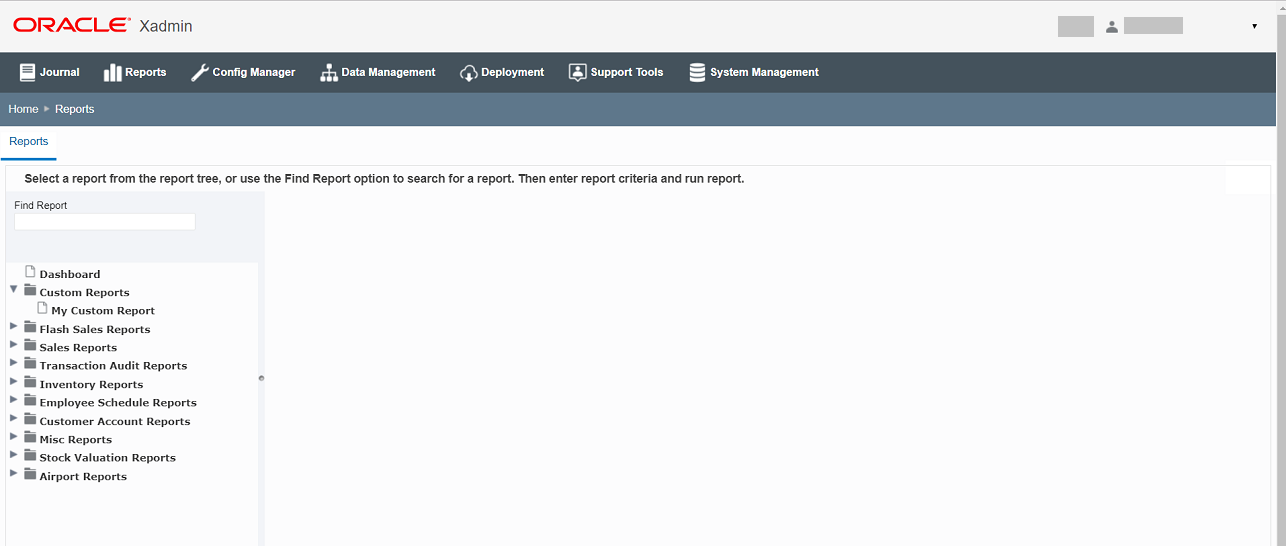
Custom Reports
-
Custom Report(s)
If a custom report is uploaded the Custom Reports category will be created. All new custom reports uploaded to the application will be accessible in the Custom Reports category.
Sales Reports Category
-
Daily Sales & Cash Report
-
Sales By Hour Report
-
Sales By Hour Analysis Report
-
Sales Overview Report
-
Returned Merchandise Report
-
Daily Sales Report
-
Best Sellers Report
-
Credit Card Report
-
Stamp Tax Report
Stock Valuation Report
Note:
For more information about the Stock Valuation Reports, see the Stock Valuation Overviewsection
.-
WAC Reports
-
WAC Stock Valuation Report
-
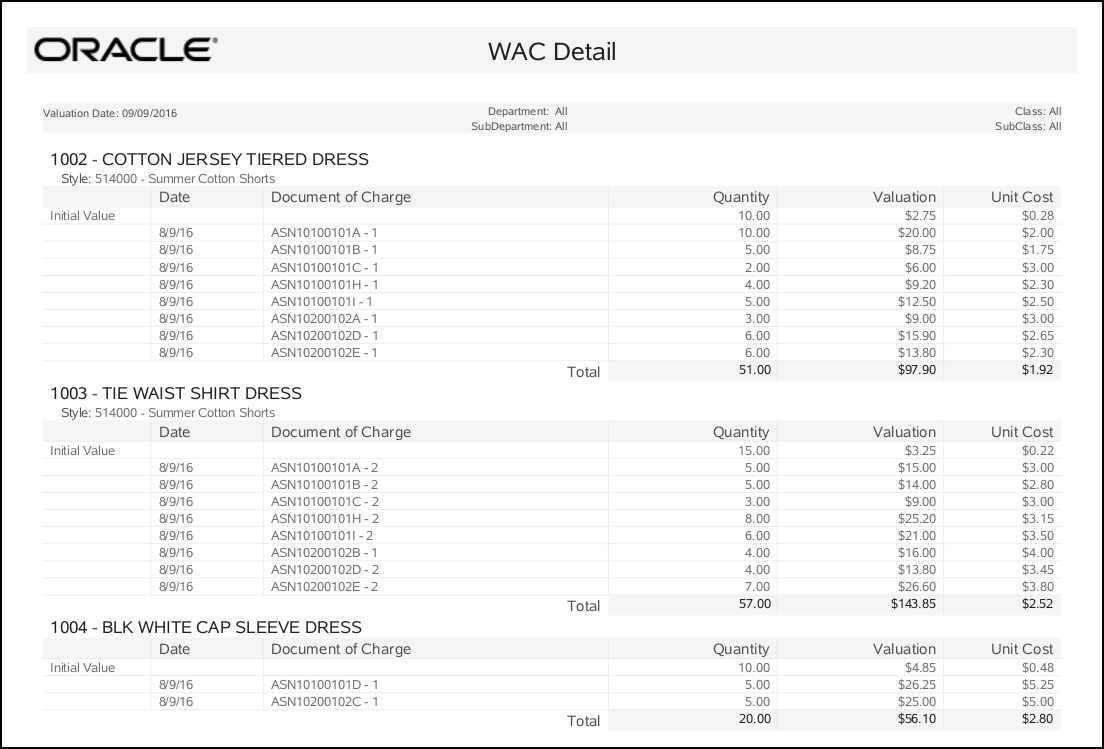
WAC Detail Report
-
-
PWAC Reports
-
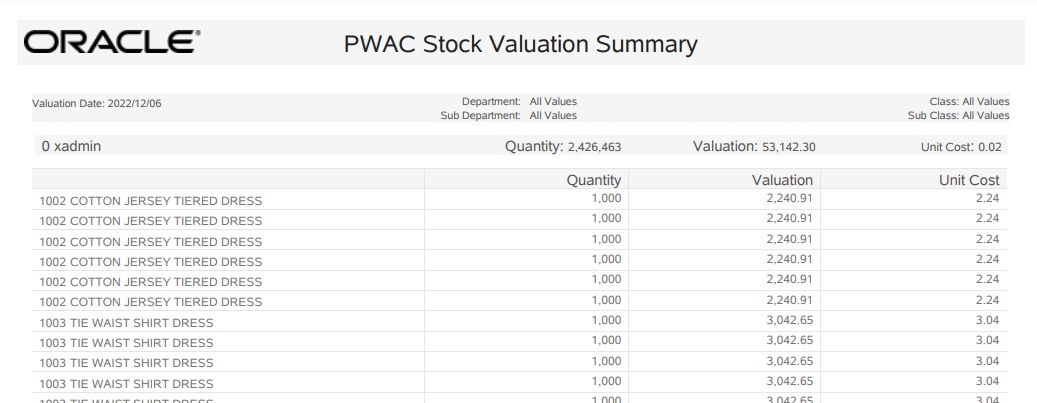
PWAC Stock Valuation Report
-
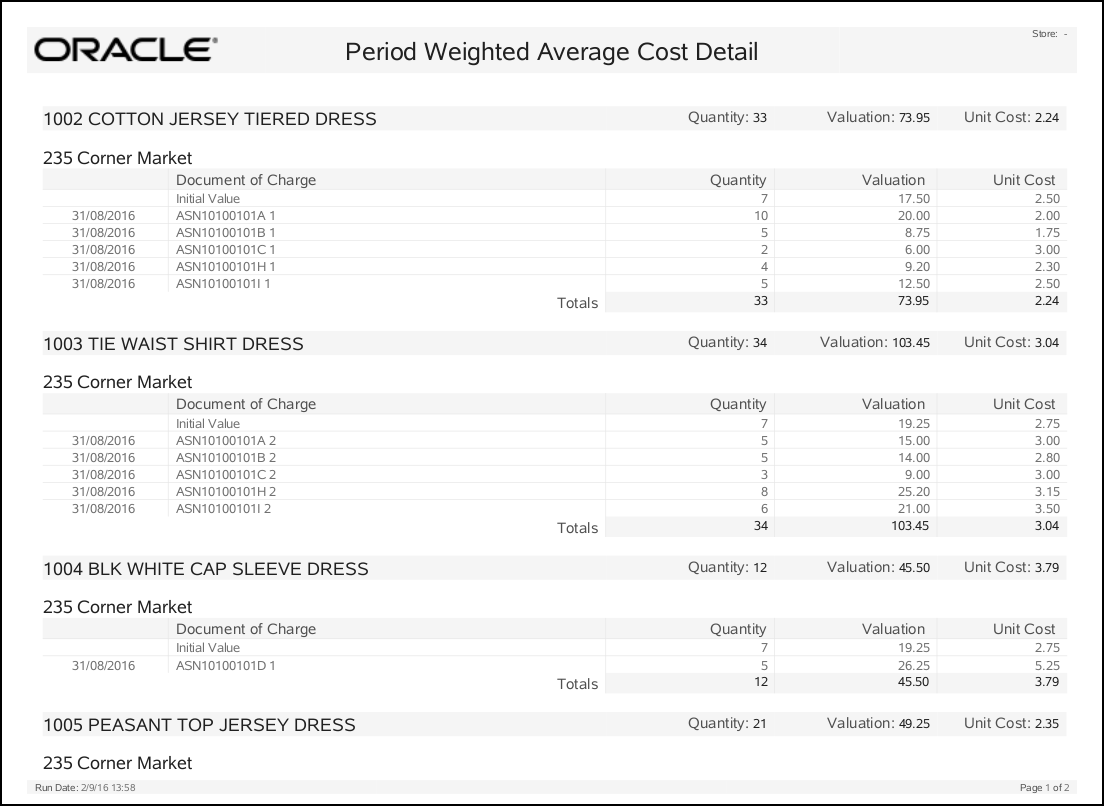
PWAC Detail Report
-
Transaction Audit Reports
-
No Sale Report
-
Price Override Report
-
Line Void Report
-
Post Void Transaction Report
-
Suspended Transaction Report
-
Cancelled Transaction Report
-
Gift Certificate Report
-
Tax Exemption Report
Inventory Reports Category
-
Shipping Exception Report
-
Receiving Exception Report
-
Inventory Stock Cost
-
Receiving Report
Customer Account Reports Category
-
Layaway Aging Report
-
Layaway Account Activity Report
-
Customer Account Activity Summary Report
Misc Reports Category
-
Journal Report
-
Store Locations Report
-
Customer List Report
-
Special Orders Report
-
Price Change Report
-
Item List Report
-
Employee Tasks Report
-
Register Count Report
Note:
For more information about the Stock Valuation Reports, see the Register Count Reportsection
.
Dashboard
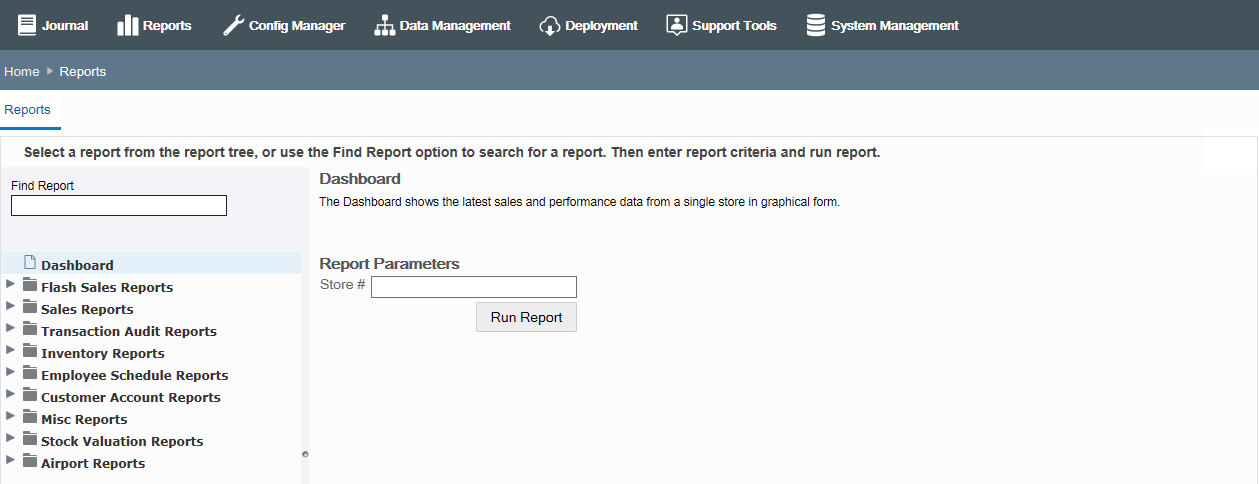
Use the dashboard report to view sale data for individual stores. The dashboard shows enterprise data for a single store, as a static page. If you want to refresh the data, you need to re-run the report.
The header displays the store number, the store name as well as the current business date.
The following data is displayed for the selected store:
-
Total Sales (Gross Sales, Net Sales, Returns, Discounts, Total Tax)
-
Sales by Department (top 10)
-
Sales by Hour
-
Number of Items (by hour)
-
Number of Transactions (by hour)
To create the Dashboard report follow the steps below:
-
In the Oracle Retail Xstore Office Cloud Service, select Reports and then select Dashboard.
Figure 9-3 Reports - Dashboard
-
In the Store # field, enter the number of the store you want to create the report for.
-
Then click Run Report.
Stock Valuation Overview
Stock Valuation is a process that allows you to track the item stock value for receivables at the store for both corporate-created receiving documents and store-created receiving documents. This inventory valuation allows you to determine a monetary value for items that make up your inventory, and is dependent on a "year-end" process for the company. Stock valuation is based on the fiscal calendar.
All receiving documents must contain the items' cost to be used to calculate the stock valuation. (The cost is the amount charged to the franchisee/store.) When merchandise is received from the warehouse, the cost on the ASN/receiving document must be accepted or adjusted by the store in order to receive merchandise into inventory.
Note:
Store to store transfers must be implemented through the corporate office. The corporate office will be responsible for crediting the shipping stores' cost for the stock, and for applying the proper cost value for each item on the receiving document for the receiving store.
Some retailers may elect to carry the cost for corporate stores from the shipping store to the receiving store, but a corporate system will still be responsible for providing the cost per item to the receiving store.
Prerequisites and Assumptions
-
The inv_cst_item_yearend table must be populated with data for the previous year. For new retailers with no previous years' data, a record must be added for the previous year with quantity zero This information is required to run the Year End Rollup.
-
Reports are available from Oracle Retail Xstore Office only.
-
For reporting, the Arial Unicode MS font must be installed on the system.
Two methods of stock valuation are supported:
-
PWAC - Period Weighted Average Cost
-
WAC - Weighted Average Cost
Period Weighted Average Cost (PWAC)
WAC is calculated using the fiscal year-end summary from the prior fiscal year, plus receivings from this fiscal year.
When calculating PWAC for a previous year, the system uses the fiscal year prior to the requested fiscal year, plus the receivables from the requested fiscal year up to the requested date. You cannot simply use the posted values for the requested year since that includes the entire year.
ASN documents are used in the calculations. The status of the ASN document (CLOSED, OPEN, or IN PROCESS) is disregarded.
Weighted Average Cost (WAC)
WAC is calculated using the fiscal year-end summary from prior fiscal years (multiple), plus receivings from this fiscal year, up to the specified stock valuation date. Values from the item_cost_movements table are used to perform the calculations.
When calculating WAC for a previous year, the system uses the years prior to the requested year, plus the receivables from the requested year up to the requested date. You cannot simply use the posted values for the requested year since that includes the entire year.
ASN documents are used in the calculations. The status of the ASN document (CLOSED, OPEN or IN PROCESS) is disregarded.
Register Count Report
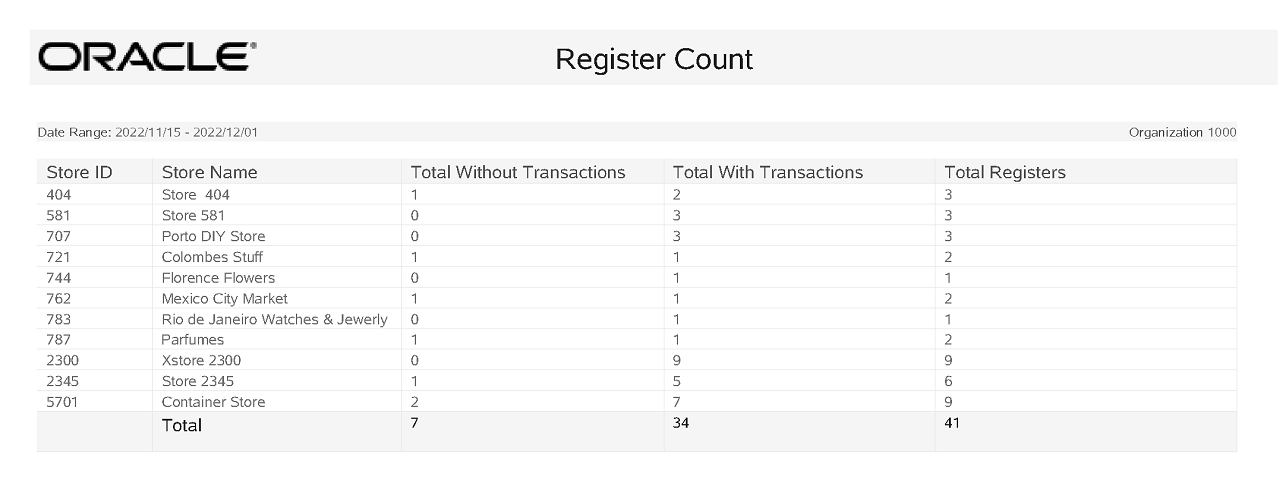
The Register Count report is run for the entire organization and will display the number of registers for each store, the number of registers with transactions, the number of registers without transactions, and a grand total of all registers.
Figure 9-9 Example Register Count Report with Report Criteria
