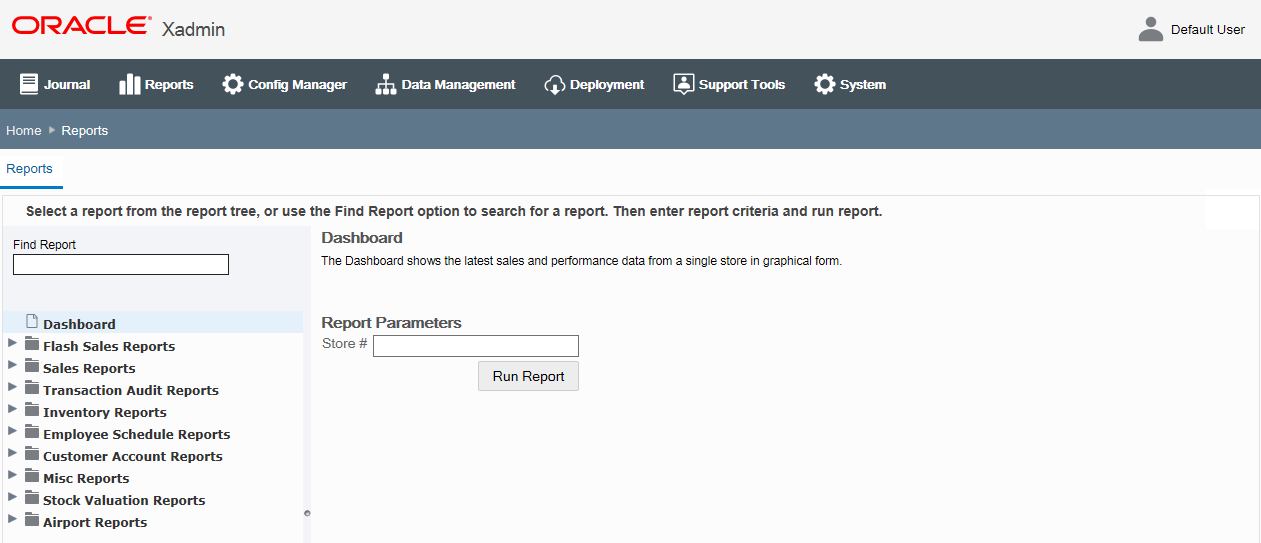
Dashboard
Use the dashboard report to view sale data for individual stores. The dashboard shows enterprise data for a single store, as a static page. If you want to refresh the data, you need to re-run the report.
The header displays the store number, the store name as well as the current business date.
The following data is displayed for the selected store:
-
Total Sales (Gross Sales, Net Sales, Returns, Discounts, Total Tax)
-
Sales by Department (top 10)
-
Sales by Hour
-
Number of Items (by hour)
-
Number of Transactions (by hour)
To create the Dashboard report follow the steps below:
-
In the Oracle Retail Xstore Office, select Reports and then select Dashboard.
Figure A-8 Reports - Dashboard

-
In the Store # field, enter the number of the store you want to create the report for.
-
Then click Run Report.
