Merchandise Sales Analysis Report
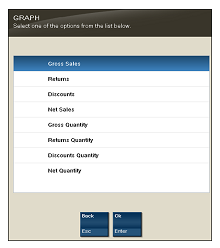
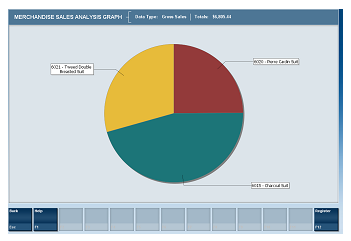
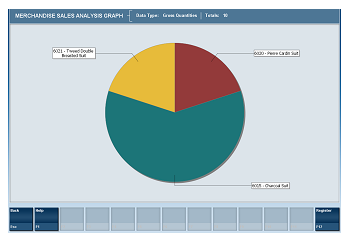
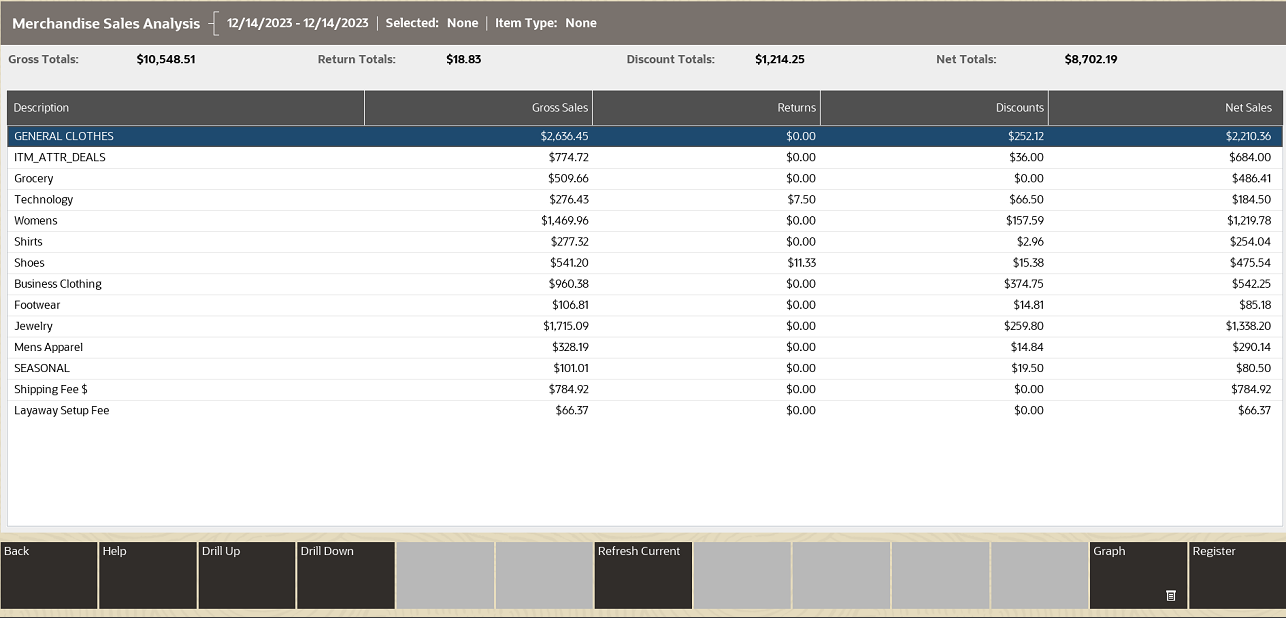
The Merchandise Sales Analysis report displays item merchandise hierarchy sales information. You may choose to drill-down into merchandise hierarchy levels to the item level by selecting a row and then selecting Drill Down. To return to the list select Drill Up. You can also sort by selecting a column name. Select Graph to create a pie chart.
Figure 4-14 Graph Options

Note:
Touch-screen users tap the row or column to drill down or sort.
Swipe down anywhere on a column (for example, Returns) to display a pie chart of totals (instead of selecting the Graph menu button).

Swipe up anywhere on a column to display a pie chart of quantities.

The parenthesis contains the number of items.
Table 4-13 Merchandise Sales Analysis Parameters
| Parameters | Description |
|---|---|
|
Gross Totals |
Amount of all items sold. |
|
Return Totals |
Amount of all returns. |
|
Discount Totals |
Amount of all discounts. |
|
Net Totals |
Net amount of all sales. |
|
Description |
The item description. |
|
Type |
The department or item number. |
|
Gross Sales |
Total sales amount by item. |
|
Returns |
Total amount of the item returned. |
|
Discounts |
Total amount of the item discounted. |
|
Net Sales |
The total net amount of all sales transactions for the item. |
Criteria Selections for Merchandise Sales Analysis Report
Select an option or make entries in any of the following fields to determine report output:
-
Date Range: Enter a single fixed date, a date range (begin and end dates) or select a relative date option (Yesterday, Last Week, and so on) from the drop-down list.
Figure 4-15 Merchandise Sales Analysis Report

Note:
Select the Refresh Current button to update the report with current data.
Figure 4-16 Sample: Drill-Down
