24 Hour Chart for Flat Rates Module
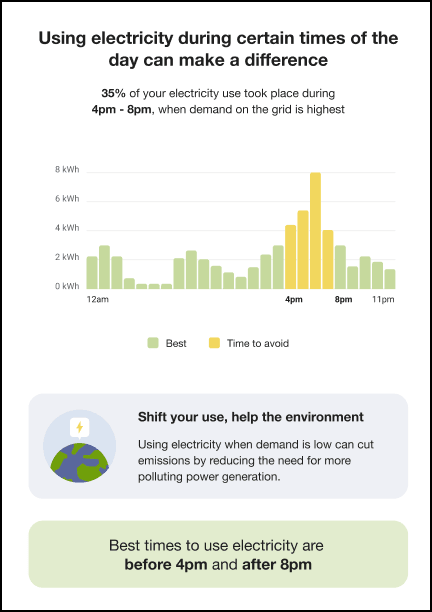
The 24 Hour Chart for Flat Rates module helps customers understand how their electricity usage is distributed throughout the day, with a specific focus on peak hours. It shows how much electricity they used during peak periods and provides a clear 24-hour view of their average usage over the past week.
The chart makes consumption patterns easy to interpret at a glance. By visualizing when energy is used most and highlighting opportunities to shift usage, this module encourages customers to make more informed decisions about when they consume electricity. These changes can help reduce strain on the grid during peak periods and support environmentally responsible energy usage.
For utilities, this module supports demand management goals and promotes energy-conscious behavior. It enhances customer engagement by delivering timely, relevant insights that encourage customers to shift usage to optimal times, improving grid efficiency and contributing to a more sustainable energy system.
User Experience
This module includes the following components:
Heading: A title that introduces the purpose of the chart and focuses on peak hour usage. For example, “Using electricity during certain times of the day can make a difference”.
Usage Statement: A statement that summarizes the customer’s average weekly peak usage. For example, “35% of your electricity use took place during 4pm - 8pm, when demand on the grid is highest”.
24-Hour Chart: A bar chart that shows the customer’s average electricity usage by hour over the past week. The chart highlights peak hours so the customer can see how they are using electricity during times the utility would like them to avoid.
Environmental Statement: This section begins with the heading, "Shift your use, help the environment" and includes a statement that explains how shifting usage can benefit the environment. For example, “Using electricity when demand is low can cut emissions by reducing the need for more polluting power generation.”
Best Times Statement: A reminder of the best times to use electricity. For example, “Best times to use electricity are before 4pm and after 8pm.”
This is an example of the 24 Hour Chart for Flat Rates Module: