Note:
- This tutorial requires access to Oracle Cloud. To sign up for a free account, see Get started with Oracle Cloud Infrastructure Free Tier.
- It uses example values for Oracle Cloud Infrastructure credentials, tenancy, and compartments. When completing your lab, substitute these values with ones specific to your cloud environment.
Monitor Oracle Cloud Infrastructure with Datadog
Introduction
The Oracle Cloud Observability and Manageability platform aims to meet our customers where they are. We understand that they have standardized their operational postures with popular 3rd party Observability tools and we want to be interoperable with those tools so our customers can continue using the tools they have invested in with Oracle Cloud Infrastructure.
In this tutorial, we will walk you through how you can move logs from Oracle Cloud Infrastructure into Datadog. Datadog is a popular Observability tool that provides monitoring and security services that provide full visibility into your applications.
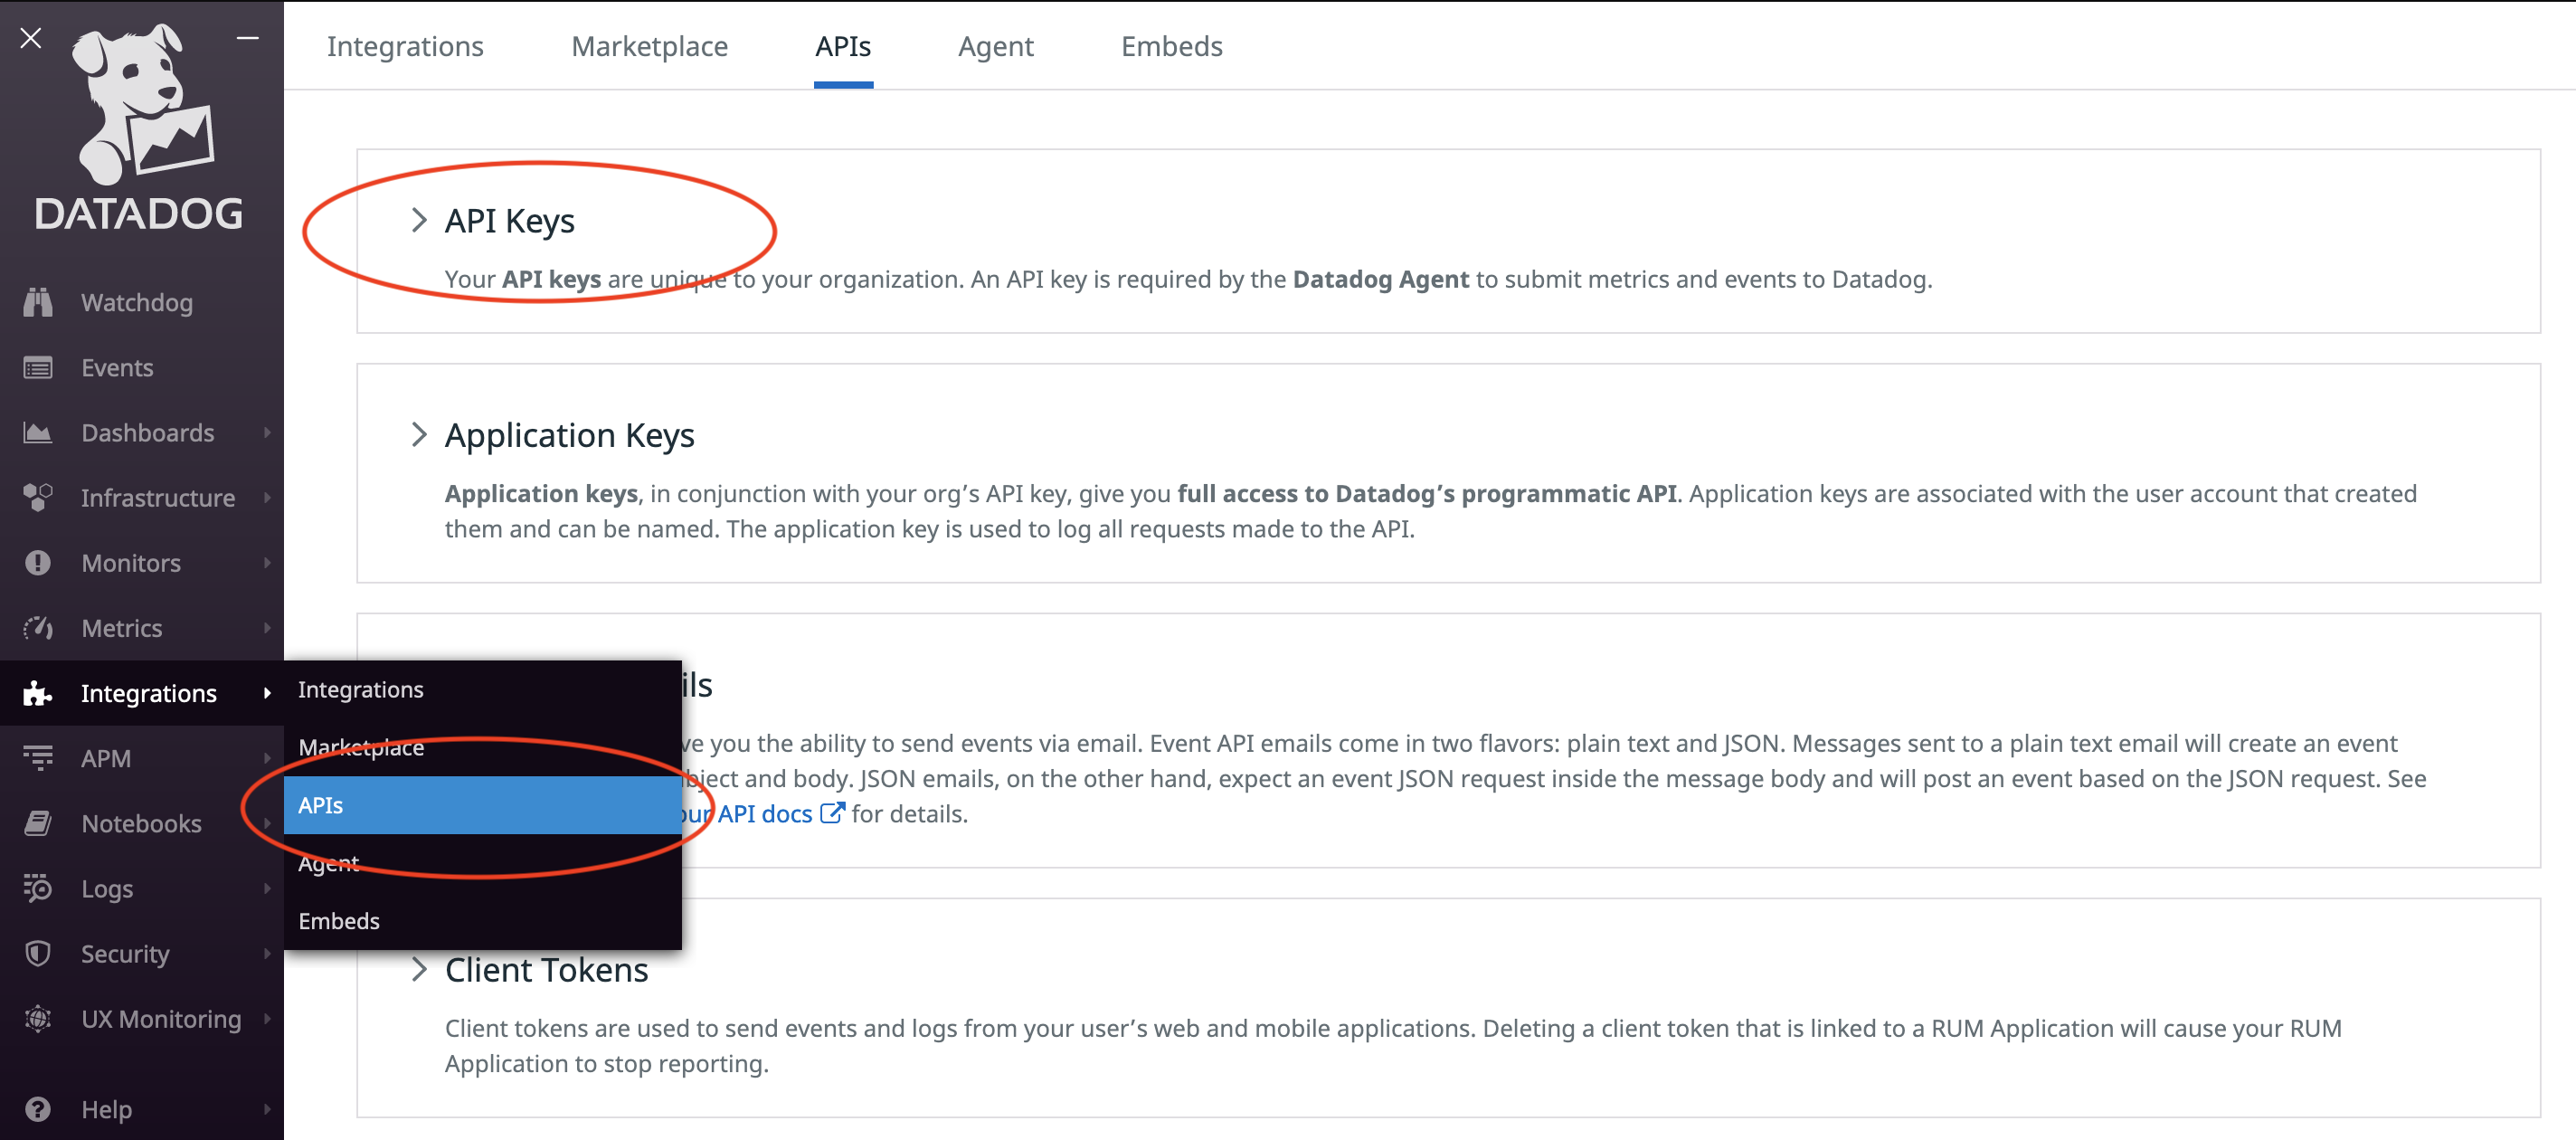
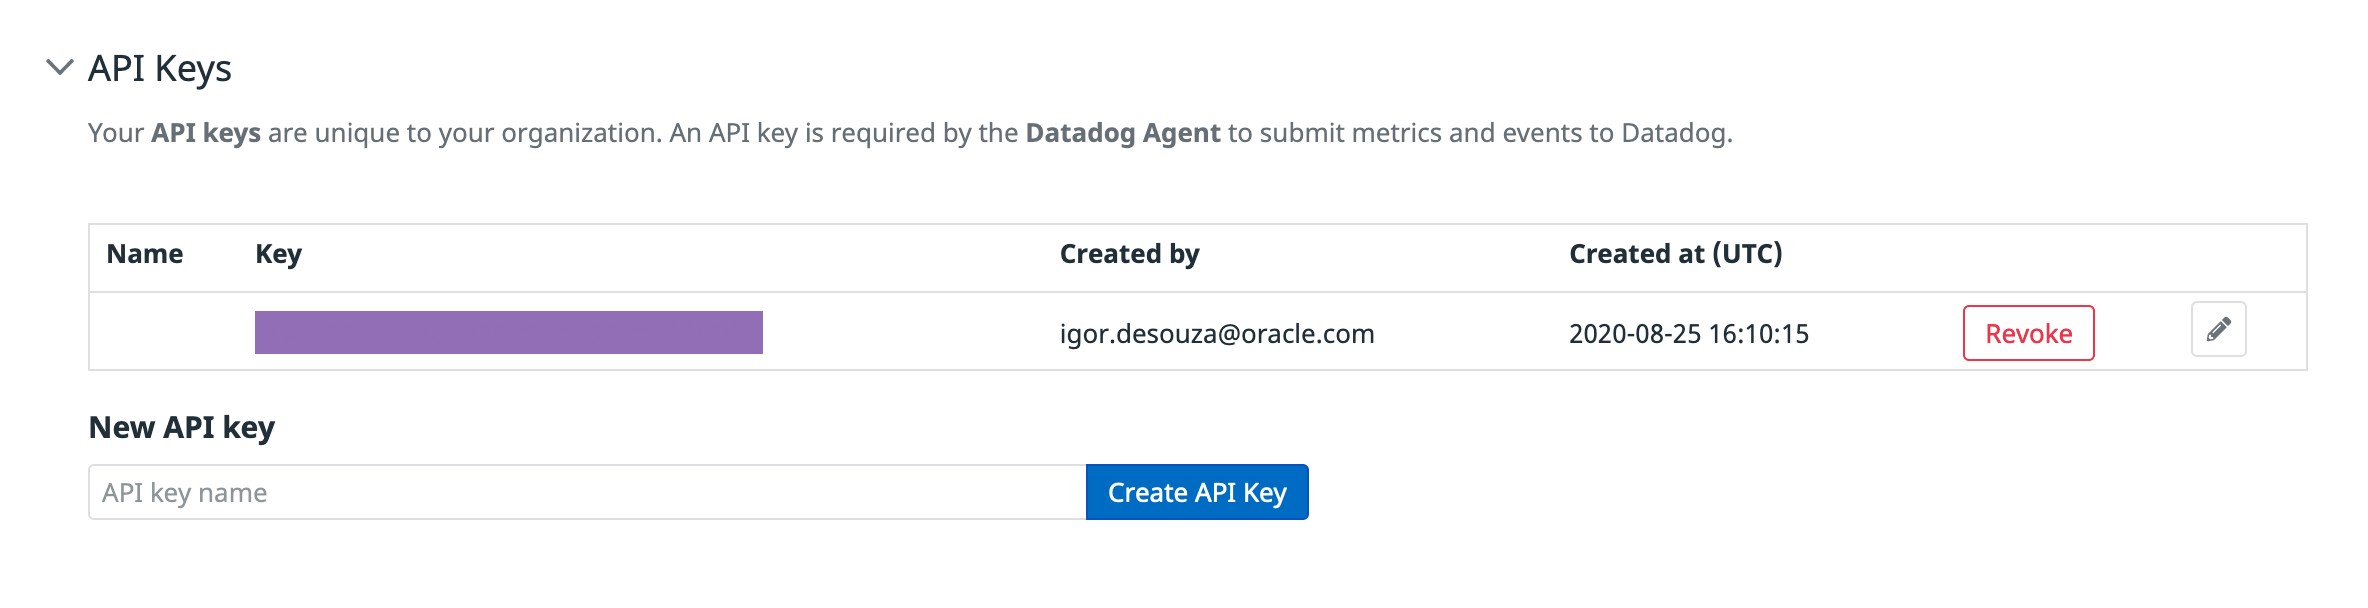
Create a Datadog API key
-
In your Datadog account, select Integrations, and under the APIs, click create API key. This will generate your API key.
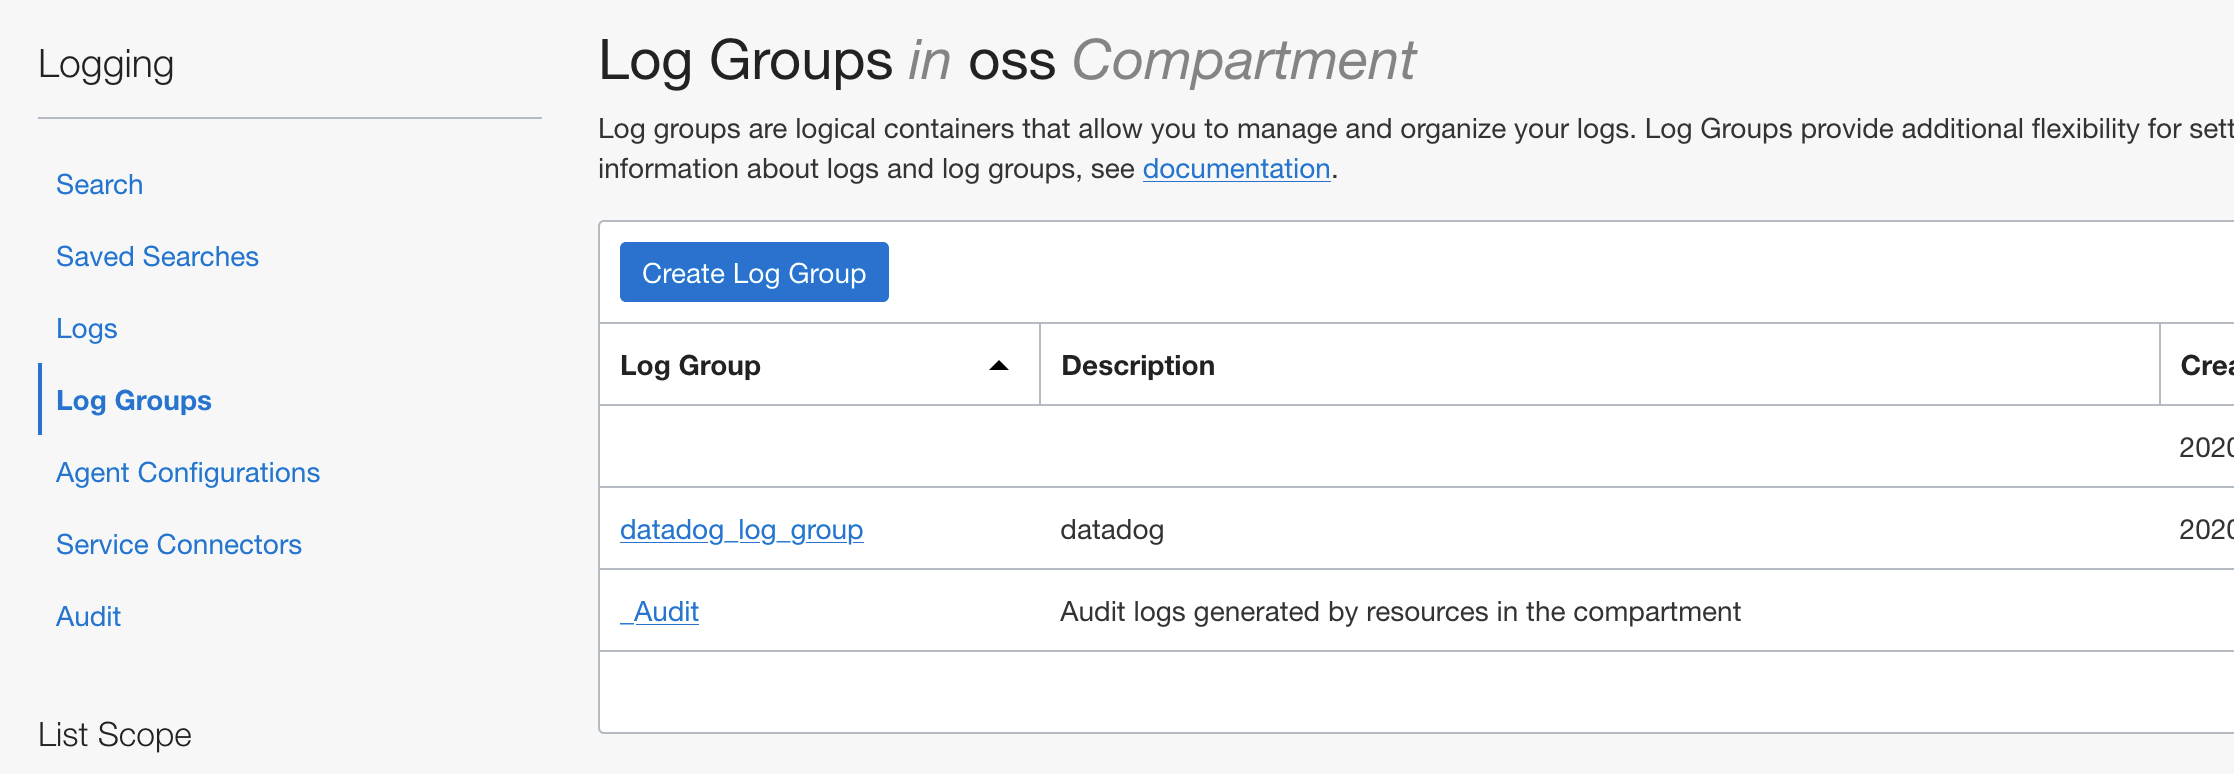
Configure the logs you want to capture
-
In the Oracle Cloud Infrastructure console, click the Navigation menu, select Log Groups under the Logging menu.
-
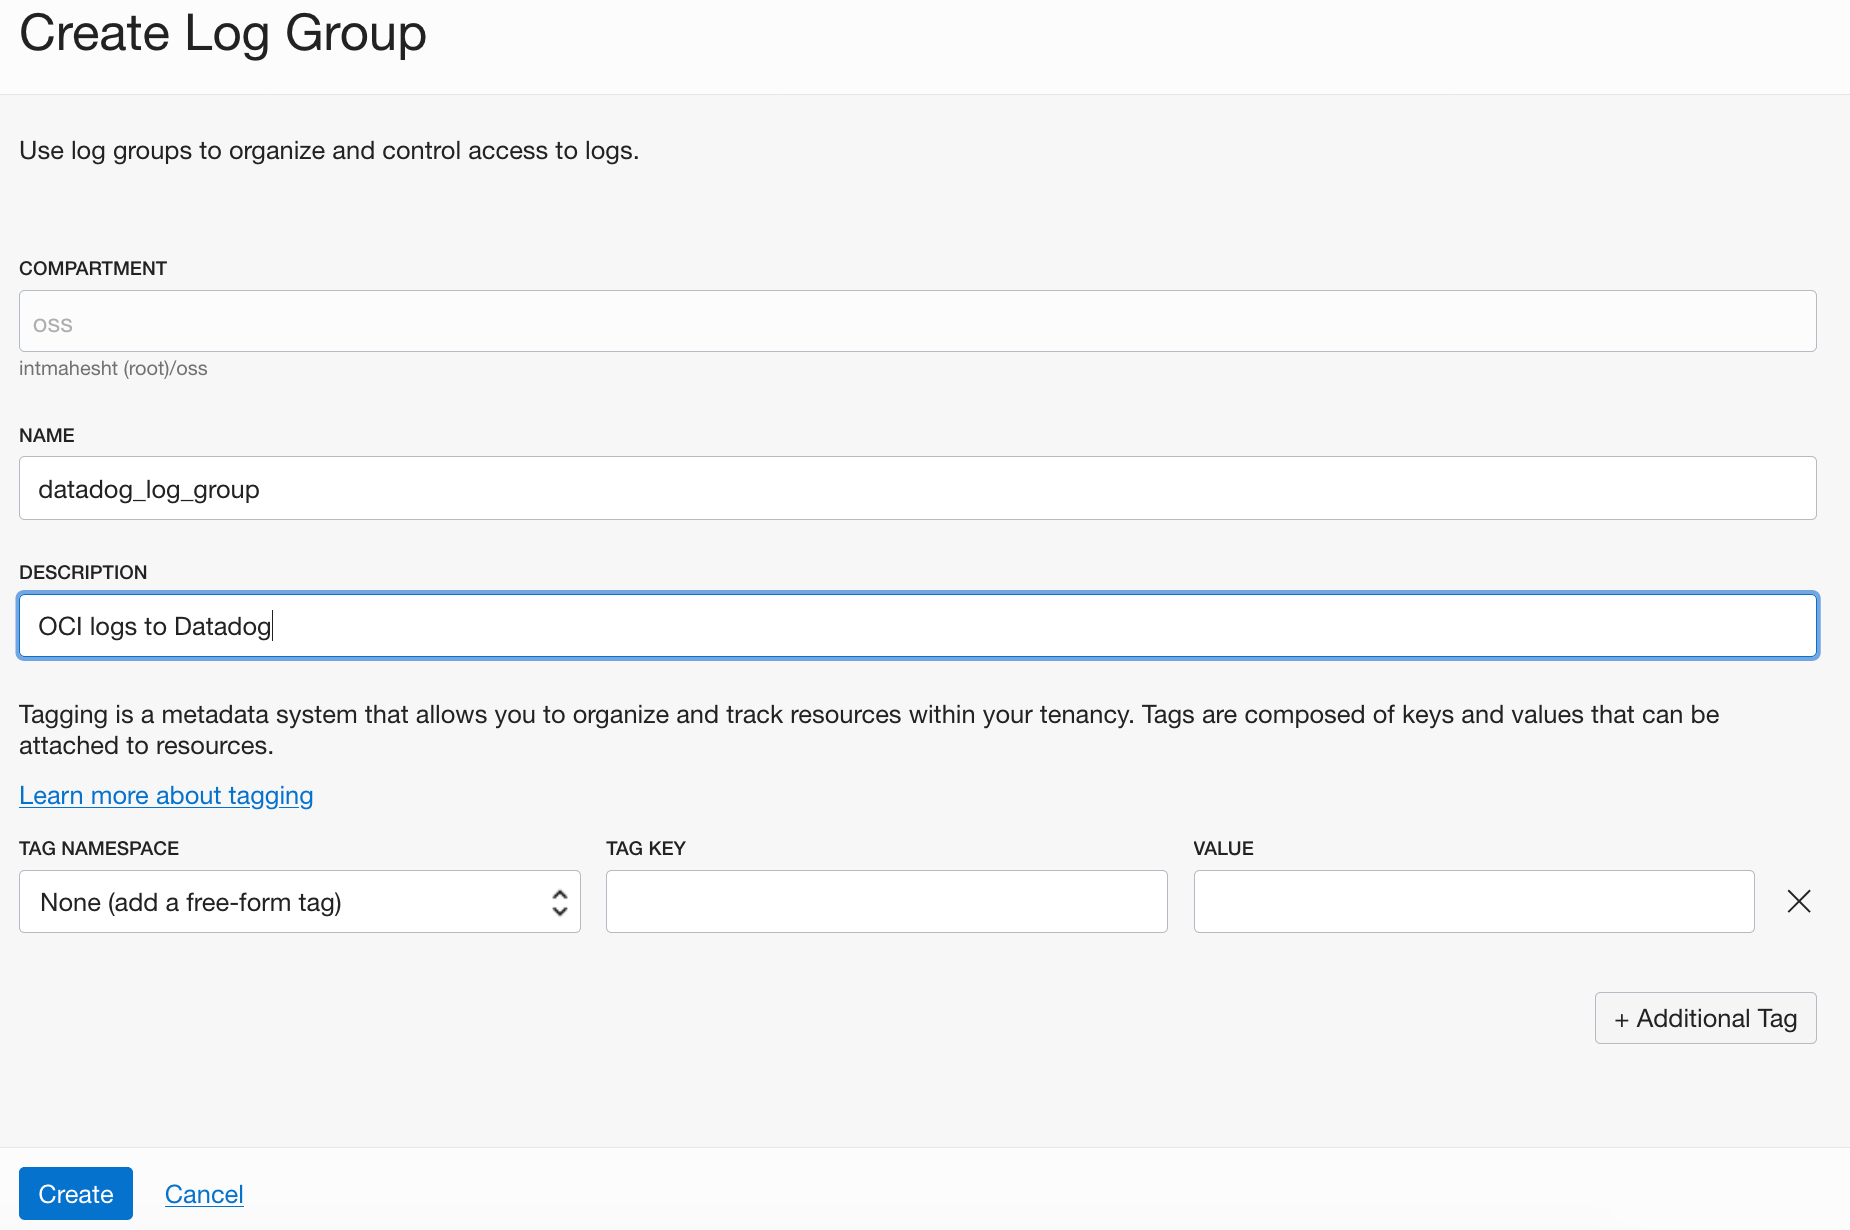
To create a log group, click Create Log Group.
-
Select your compartment, add a name data_log_group, and a description.
-
After you create Log Group, select Logs in the left menu.
-
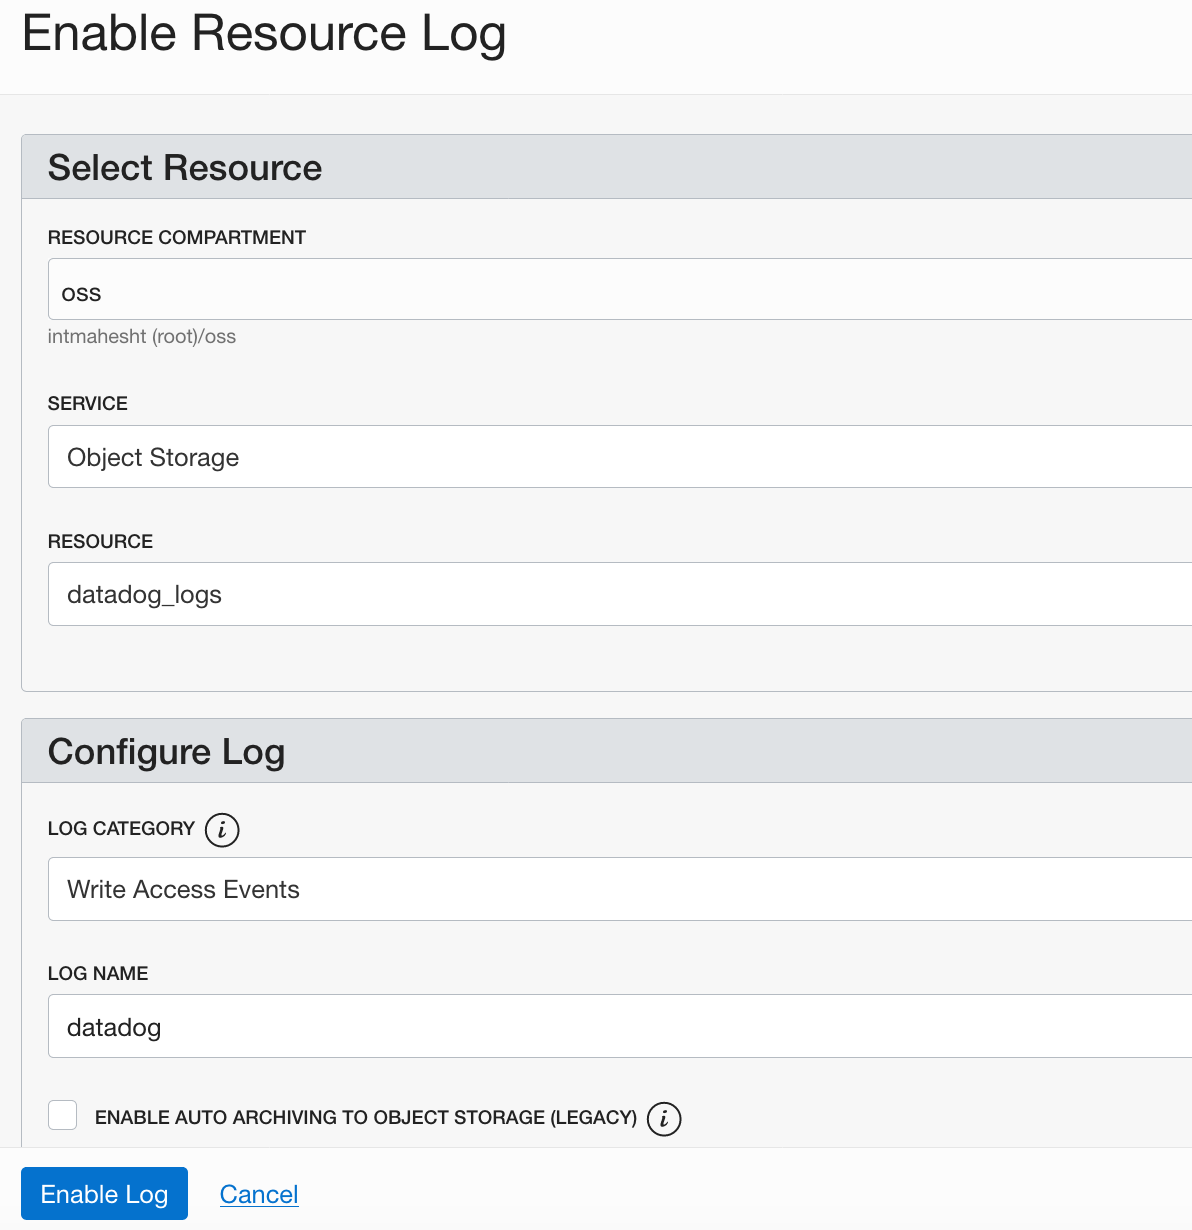
Click Enable Service Log, fill our the dialog box and click Enable Log. Select Log Category on Service.
- Resource: Enter the log that you will use as a resource.
- Log name: Enter a name for your log, for example, datadog.
Fill the rest of the fields appropriately. Refer to this example, in which Oracle Object Store with a bucket name datadog_logs is shown.
Configure Oracle Function for ingesting logs into Datadog
-
Click on the Navigation menu and then select the Solution and Platform section. Select Functions under the Developer Services menu.
-
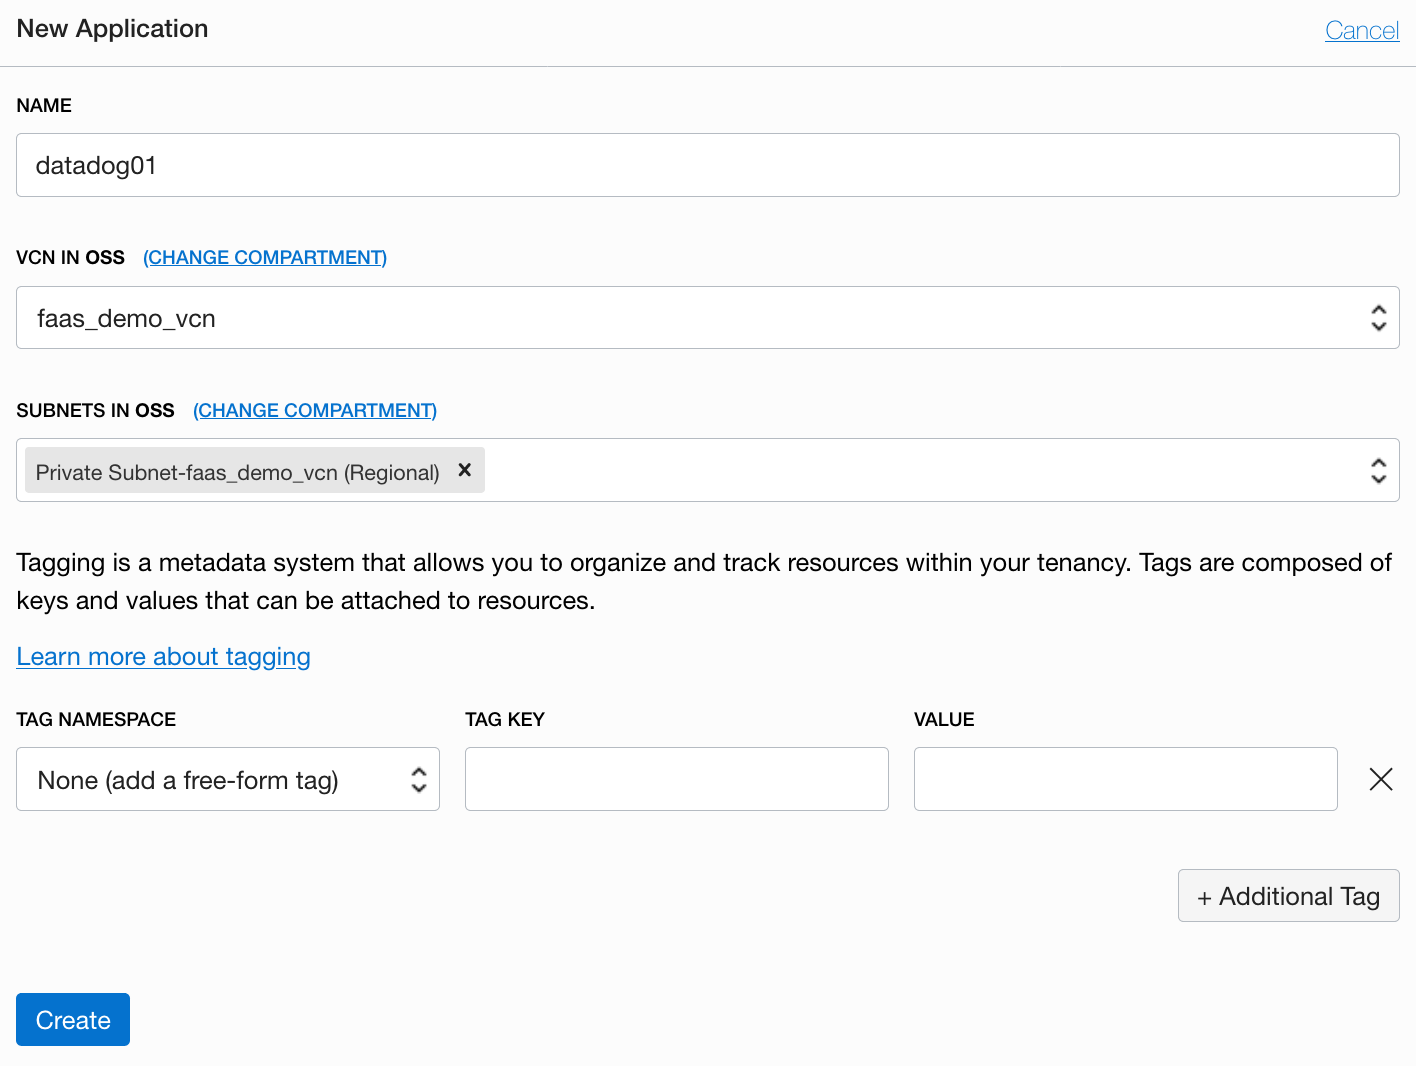
Click Create Application and enter a name, for example, datadog01.
-
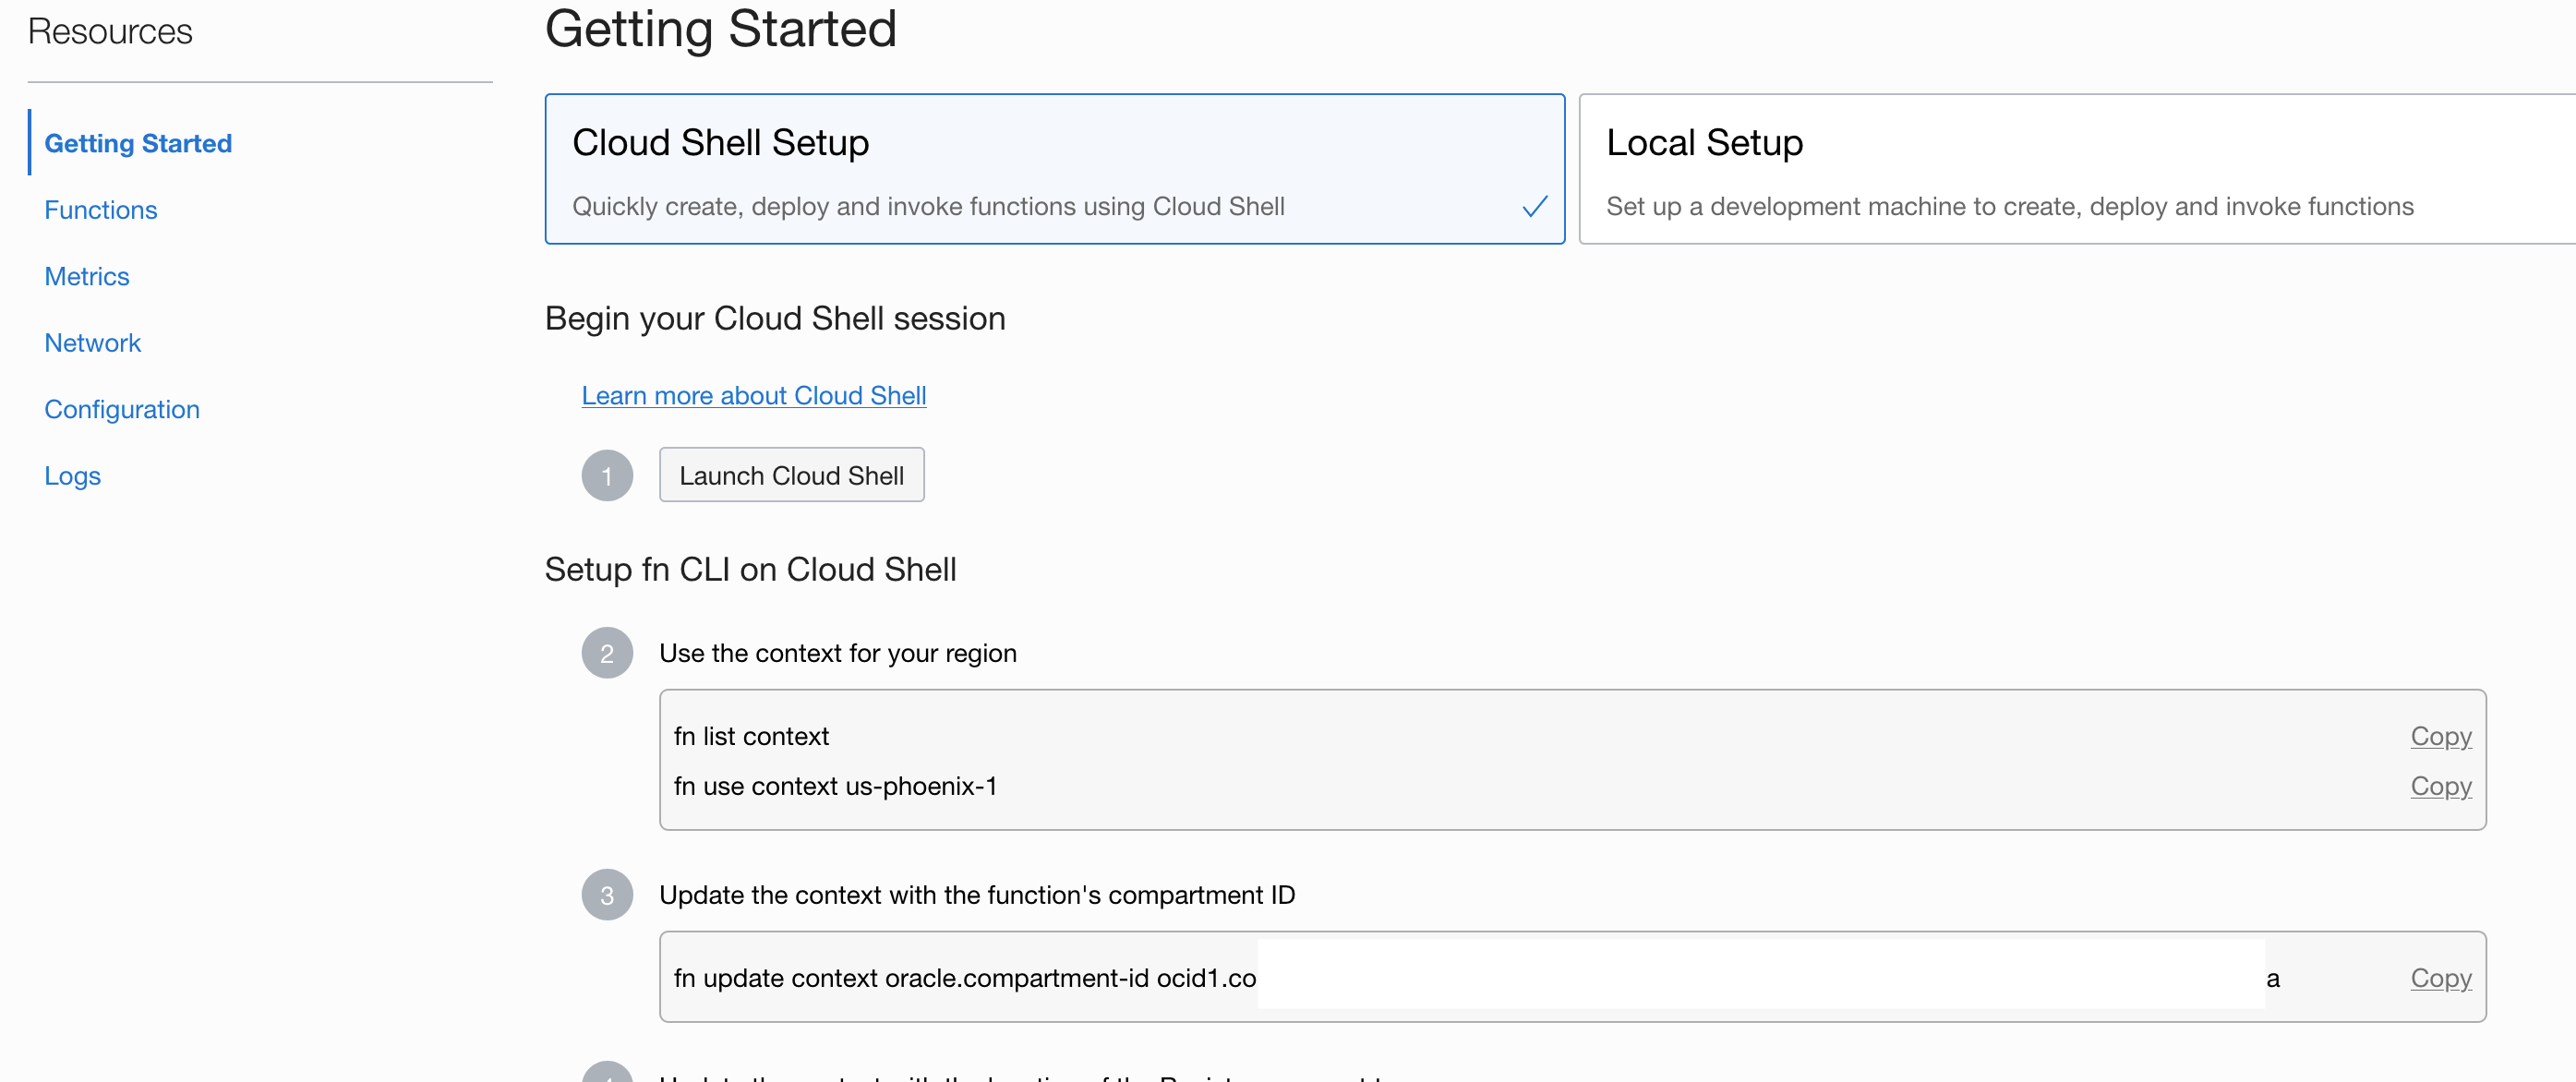
Once you create the Application, click your application name and select Getting Started on the left menu.
-
Launch Cloud Shell.
-
Use the context for your region.
fn list contextfn list context fn use context us-phoenix-1 -
Update the context with the function’s compartment ID.
fn update context oracle.compartment-id <compartment-id> -
Update the context with the location of the Registry you want to use.
fn update context registry phx.ocir.io/<tenancy_name>/[YOUR-OCIR-REPO]Replace phx with the three-digit region code.
-
Click Generate an Auth Token.
Log into the Registry using the Auth Token as your password.
docker login phx.ocir.ioReplace phx with the three-digit region code.
You are prompted for the following information:
- Username: <tenancyname>/<username>
- Password: Create a password
Note: If you are using Oracle Identity Cloud Service, your username is <tenancyname>/oracleidentitycloudservice/<username>.
-
Generate a ‘hello-world’ boilerplate function.
fn init --runtime python datadogThe fn init command will generate a folder called datadog with 3 files inside; func.py, func.yaml, and requirements.txt.
Open func.py and replace the content of the file with the following code:
-
Import the necessary Python modules, as shown in the following snippet:
import io import oci import re import os import json import sys import requests import logging import time from fdk import response -
Define a function to parse the log data and invoke the Datadog API to ingest the logs.
def handler(ctx, data: io.BytesIO=None):
   try:
     logs = json.loads(data.getvalue())
For information about the format of the logs generated by the Oracle Cloud Infrastructure Logging service, see Logging Format Overview.
-
Obtain the log source, time stamp, and data from each log entry.
if "data" in item: if type(item.get("data")) is dict: data = item.get("data", {}) else: data = item.get("data") else: data = "" if "source" in item: source = item.get("source") else: Source = "" if "time" in item: time = item.get("time") else: time = "" payload = {} payload.update({"source":source}) payload.update({"time": time}) payload.update({"data":data}) -
Create variables to store the Datadog API endpoint URL and authentication token.
datadoghost = os.environ['DATADOG_HOST'] datadogtoken = os.environ['DATADOG_TOKEN']Note: Set the values for DATADOG_HOST and DATADOG_TOKEN in func.yaml.
-
Invoke the Datadog API, with the required payload.
	  headers = {'Content-type': 'application/json', 'DD-API-KEY': datadogtoken}
	  x = requests.post(datadoghost, data = json.dumps(payload), headers=headers)
	  logging.getLogger().info(x.text)

  except (Exception, ValueError) as ex:
	  logging.getLogger().info(str(ex))
	  return
The configuration part contains the Datadog endpoint URL and the token form authentication that you got in Step 1.
The REST endpoint is https://http-intake.logs.datadoghq.com/v1/input and the details can be found in the Datadog documentation.func.yaml
schema_version: 20180708
name: datadogapp
version: 0.0.1
runtime: python
entrypoint: /python/bin/fdk /function/func.py handler
memory: 1024
timeout: 120
config:
	DATADOG_HOST: https://http-intake.logs.datadoghq.com/v1/input
	DATADOG_TOKEN: ZZZZZzzzzzzzzzz
requirements.txt
fdk datetime requests oci -
-
Create your application.
fn create app datadog01 --annotation oracle.com/oci/subnetIds='["ocid1.subnet.oc1.phx.aaaaxxxxxxxxxxx"]'Change the subnetIDs for your subnet OCID.
-
Deploy your function.
fn -v deploy --app datadog
Create a Service Connector for reading logs from Logging and triggering the Function
-
Click the Navigation menu, and select the Solution and Platform section. Select Service Connectors under the Logging menu.
-
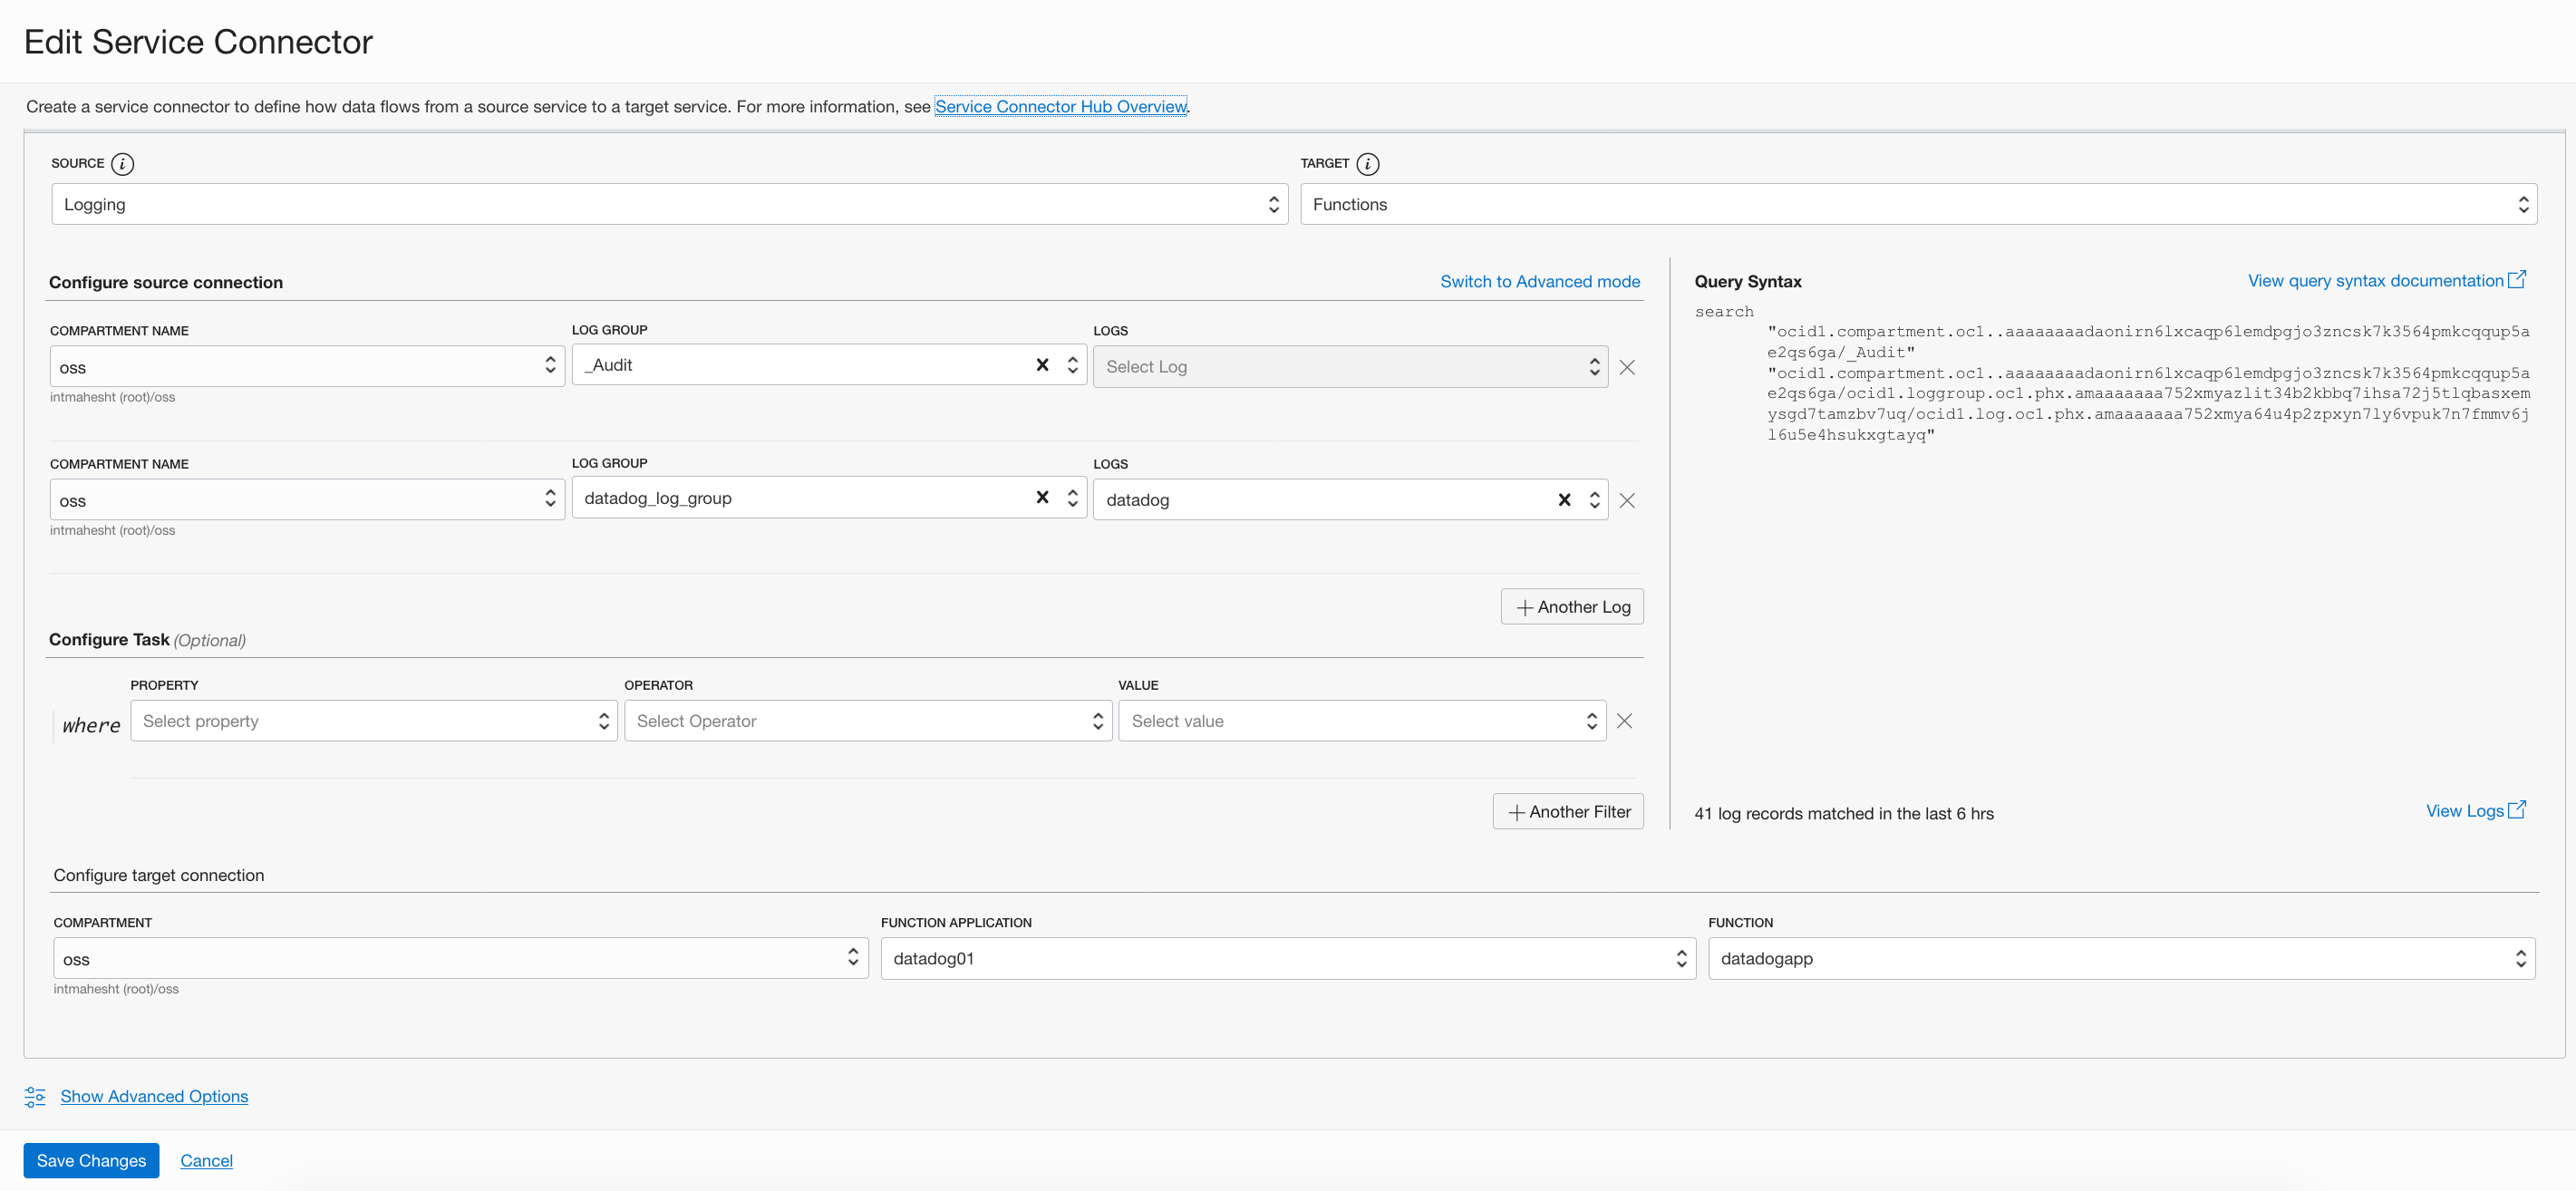
Click Create Connector and select the source as Logging and Target as Functions.
-
On Configure Source Connection select your compartment name, your log group datadog_log_group, and your logs datadog.
-
If you want to use audit logs click on +Another log button, choose your compartment and add _Audit for Log Group.
-
If prompted to create a policy for writing to Functions, click Create.
The Service Connector is now set up and will trigger the Function to ingest logs into Datadog every time it finds logs in the Logging Service.
Visualize OCI audit logs in Datadog
-
In Datadog, click the Logs menu to see logs ingested from OCI.
Troubleshoot
This section shows how you can use a simple email alert to monitor the status of your solution.
Function
For more details refer to the technical documentation.
Create a topic and a subscription for the Notification Service
-
From the menu in the upper-left corner, select Application Integration, and then select Notifications
-
Click Create Topic and create a topic with my_function_status name
-
Choose your topic, click Create Subscription and use the following example:
- Protocol: Email and add create a subscription with your email
-
The subscription will be created in “Pending” status. You will receive a confirmation email and will need to click on the link in the email to confirm your email address.
Check Metrics and create an alarm definition from metrics
-
From the menu in the upper-left corner, select Developer Services, and then select Functions
-
Choose the application and the function that you want to monitor
-
From the Metrics page, go to the “Functions Errors” chart, click on Options and Create an Alarm on this Query
-
add a name and under Notification select Destination service as notification service, select the compartment your_compartment, and select Topic as my_function_status
Service Connector Hub
This Section shows how you can use a simple email alert to monitor the status of your Service Connector Hub (SCH).
For more details refer to the technical documentation.
Create a topic and a subscription for the Notification Service
-
From the menu in the upper-left corner, select Application Integration, and then select Notifications
-
Click Create Topic and create a topic with my_sch_status name
-
Choose your topic, click Create Subscription and use the following example:
- Protocol: Email and add create a subscription with your email
-
The subscription will be created in “Pending” status. You will receive a confirmation email and will need to click on the link in the email to confirm your email address.
Check Metrics and create an alarm definition from metrics
-
From the menu in the upper-left corner, select Logging, and then select Service Connectors
-
Choose the connector that you want to monitor and click on metrics link under resources in the left navigation pane
-
From the metrics chart that you want to add the alarm e.g., “Service Connector Hub Errors”, click on Options and Create an Alarm on this Query
-
add a name and on Notification select Destination service as notification service, select the compartment your_compartment, and select Topic as my_sch_status
Conclusion
This tutorial showed how Oracle Cloud Infrastructure and Datadog customers can configure a low-overhead and highly scalable solution for moving logs from Oracle Cloud Infrastructure Logging to Datadog using Service Connector Hub and Functions.
Acknowledgements
Author - Igor Aragao de Souza (Principal Big Data Consultant)
More Learning Resources
Explore other labs on docs.oracle.com/learn or access more free learning content on the Oracle Learning YouTube channel. Additionally, visit education.oracle.com/learning-explorer to become an Oracle Learning Explorer.
For product documentation, visit Oracle Help Center.
Monitor Oracle Cloud Infrastructure with Datadog
F36991-06
October 2022
Copyright © 2022, Oracle and/or its affiliates.