Note:
- This tutorial requires access to Oracle Cloud. To sign up for a free account, see Get started with Oracle Cloud Infrastructure Free Tier.
- It uses example values for Oracle Cloud Infrastructure credentials, tenancy, and compartments. When completing your lab, substitute these values with ones specific to your cloud environment.
Discover WebLogic Servers as managed targets
Introduction
Now you have the EM agent running in the same VCN with the Kubernetes cluster. In this tutorial, using the EM agent that you set up in the previous tutorial, you will use EM console to discover the WebLogic Server as a managed target type, and verify the metric data collected from the targets in the Middleware target home page.
Estimated time: 20 minutes
- Completion of the Migrating WebLogic Server to Kubernetes workshop, labs 1, 2, 3 and 4.
- Completion of the preceding tutorials in this workshop
Objectives
- Discover WebLogic Servers as managed targets
Discover WebLogic Domain
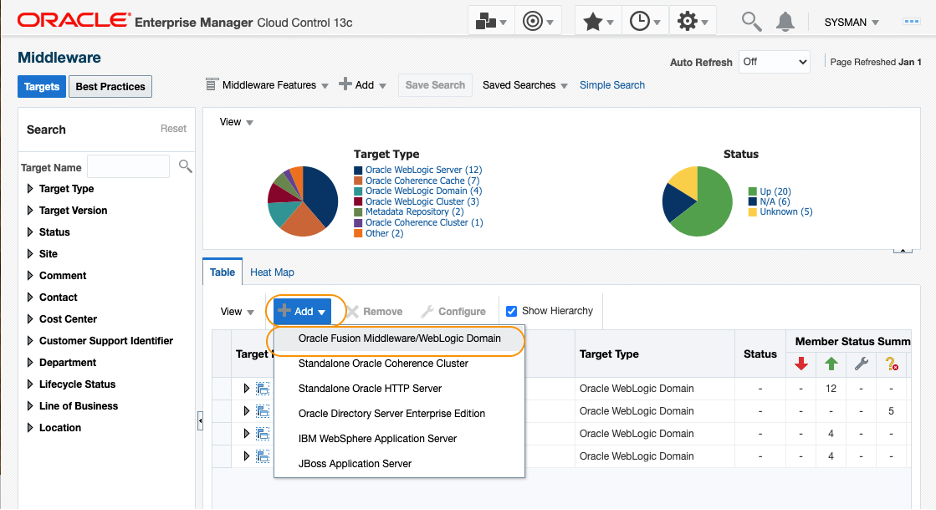
- From the menu bar in the EM console, select Targets (A double ring icon) > Middleware to navigate to the Middleware home page.

-
In the Middleware home page, click Add > Oracle Fusion Middleware/WebLogic Domain
-
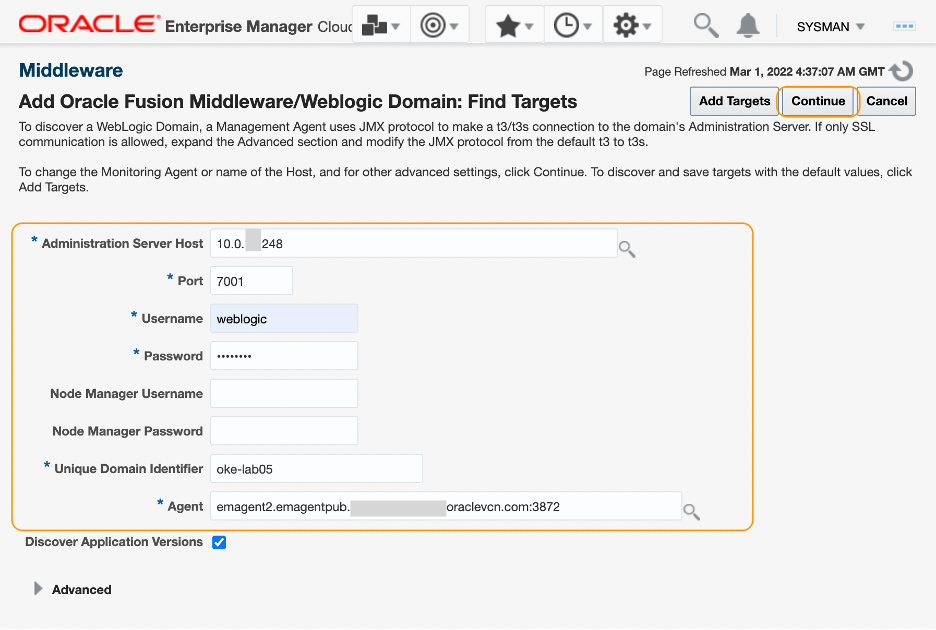
In the Add Oracle Fusion Middleware/WebLogic Domain: Find Targets page, enter the following information in the fields. Then click Continue.
- Administration Server Host: External-IP of the Load Balancer that is mapped to the admin server, saved in the Tutorial 3, Task 3
- Port: 7001
- Username: weblogic
- Password: The password generated in the Migrating WebLogic Server to Kubernetes workshop, Lab 4, Step 1
- Unique Domain Identifier: OKE-WLS
- Agent: Select the EM agent created in the previous tutorial
NOTE: You can run kubectl get svc -n sample-domain1-ns in the Cloud Shell to find the External-IP of the load balancer service for the Admin Server.
-
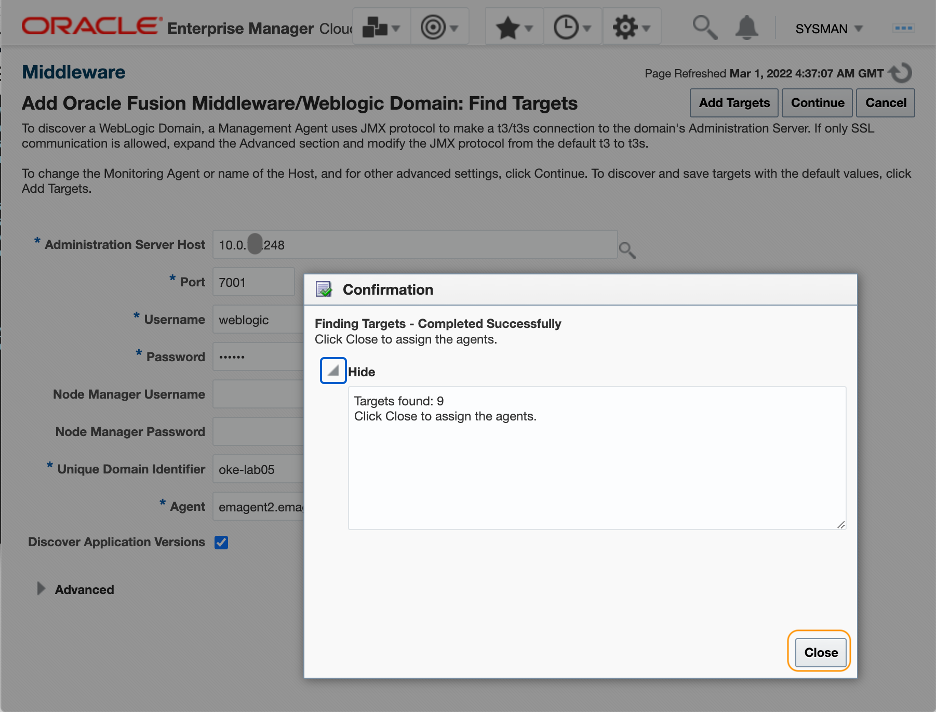
Confirmation window appears upon successful completion on the search. Click Close.
-
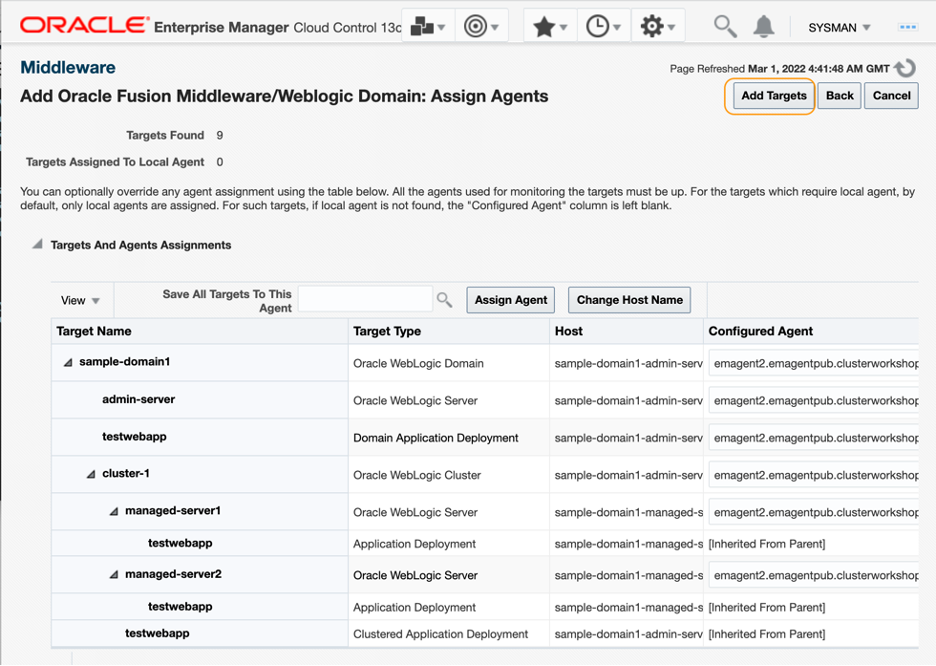
In the Assign Agents page, review the targets found, then click Add Targets.
-
Confirmation window shows up. Click Close.

-
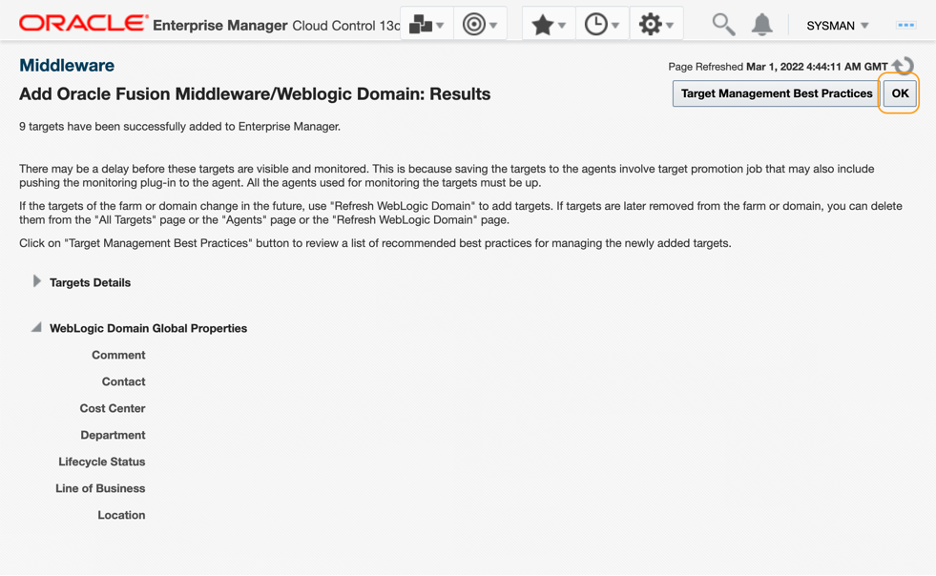
In the Results page, click OK.
Validate the WebLogic Server metrics
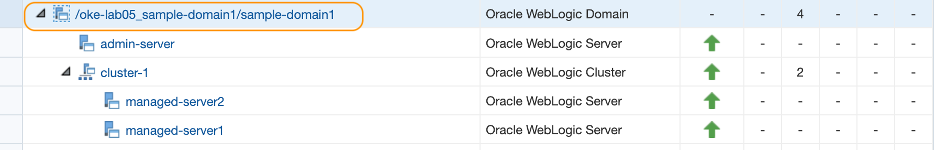
- In the Middleware home page, confirm the WebLogic Domain, WebLogic Servers and the WebLogic cluster were added to the Target section. Refresh the page to see the status updated. It may take few minutes to see the targets fully in the running status.
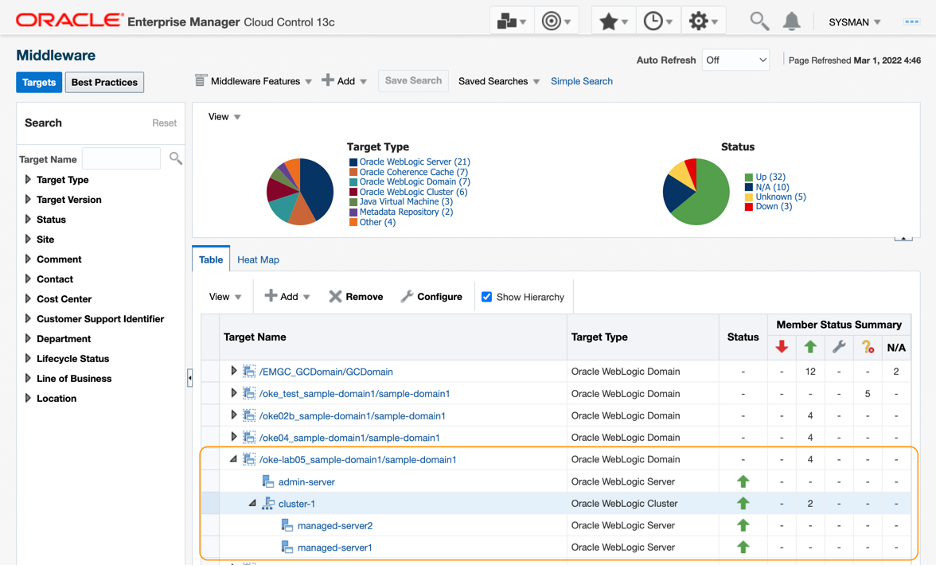
- Click the WebLogic Domain target link from the table view.
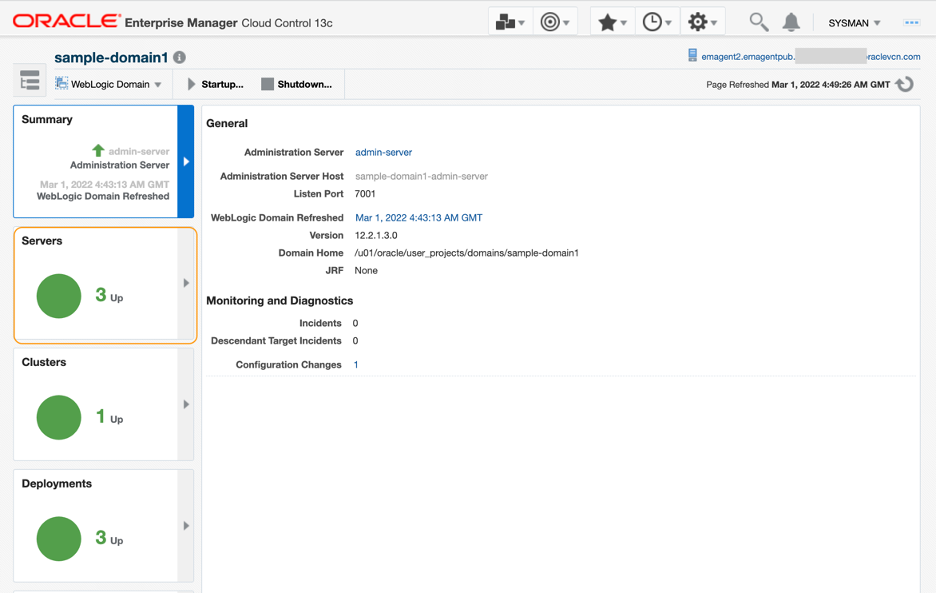
- Domain Home page opens. Click Servers.
-
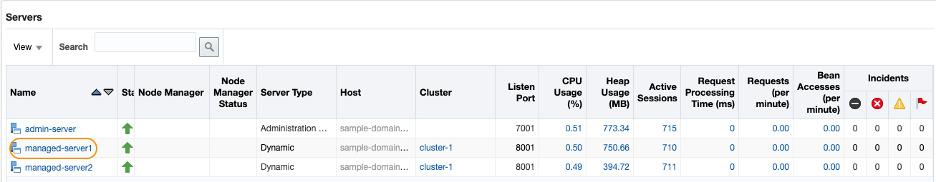
In the domain home page, observe the status and performance information of the WebLogic servers displayed. Click managed-server1 link.
NOTE: It may take few minutes after the discovery for some metrics to display the values.
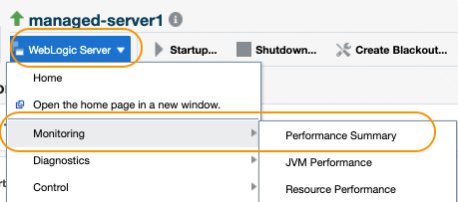
- In the WebLogic Server target home page, select WebLogic Server > Monitoring > Performance Summary, to open a WebLogic Server Performance dashboard.
-
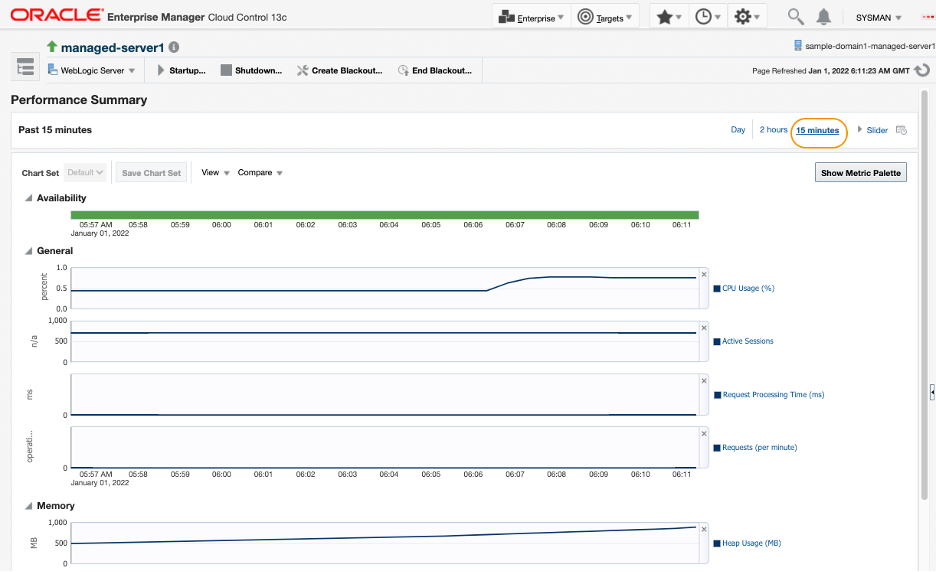
In the Performance Summary page, review the dashboard and verify that the metric data is coming in to the EM console. The image below is the summary of the past 15 minutes. You can also check out the other dashboards as in the JVM performance to ensure the metric data is collected.
-
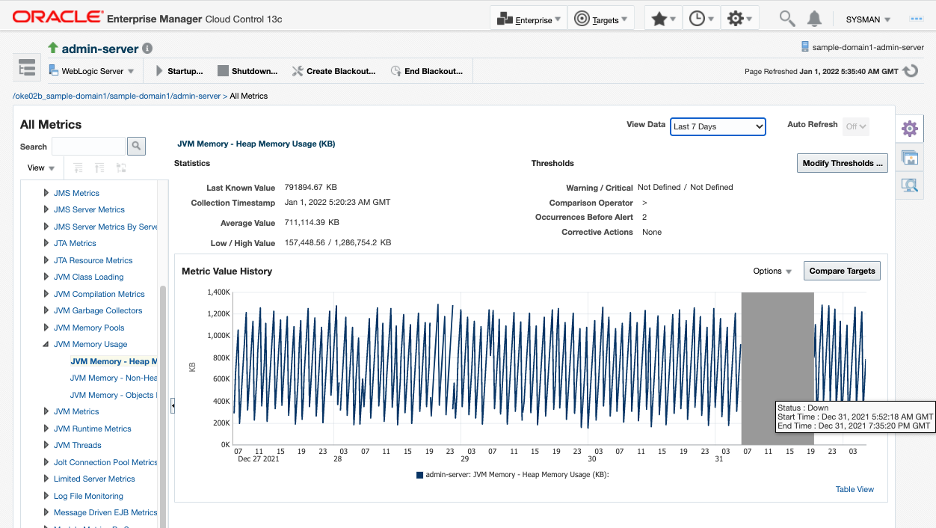
Optionally, you can navigate to All Metrics page (WebLogic Server > Monitoring > All Metrics) to examine each metric data and analyze the performance and the availability of the WebLogic Server target.
NOTE: Example image below shows the last 7 days of the metric data (WebLogic Server metric, JVM Memory – Heap Memory Usage (KB)) collected from another OKE based WebLogic Server that is running for some time.
Verify the configuration data collected from the WebLogic target
-
Next, let’s review the configuration metrics of the WebLogic target. Select WebLogic Server > Configurations.
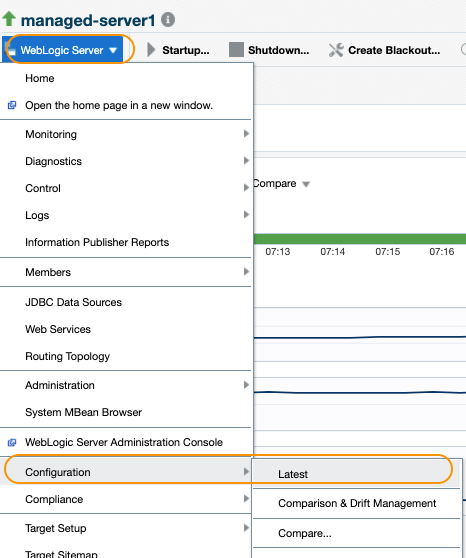
-
In the Latest Configuration page, review the values that are collected.
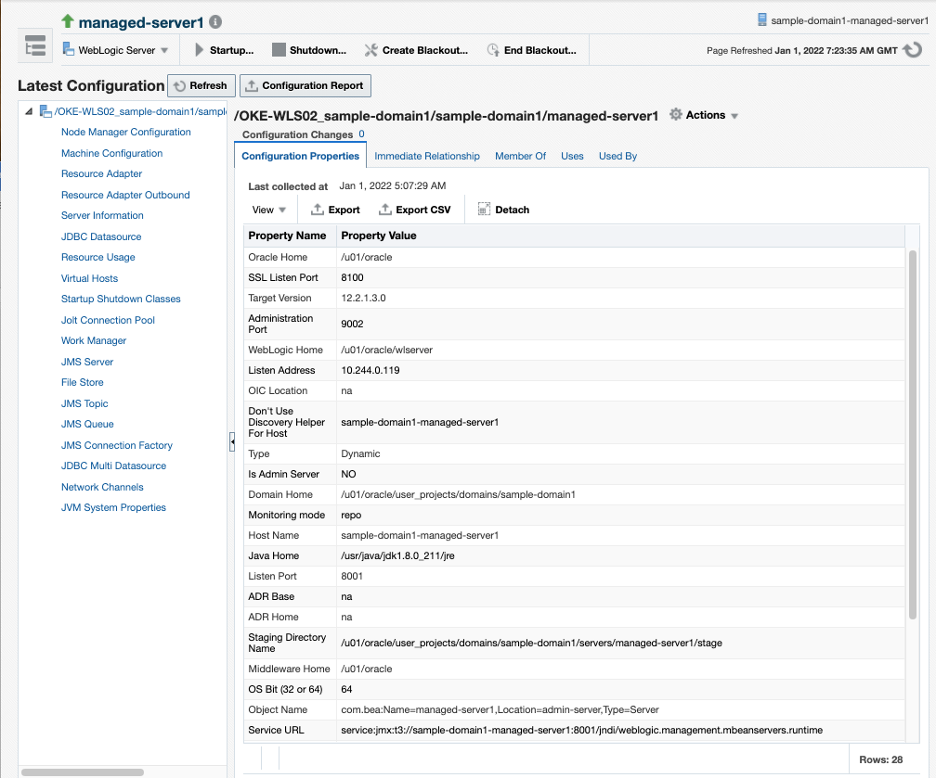
NOTE: As mentioned in the Limitation section in the Introduction of this workshop, only JMX based configurations are collected. Because there is no local agent in the target host, file-based configurations are not collected.
You may now proceed to the next tutorial.