Note:
- This tutorial requires access to Oracle Cloud. To sign up for a free account, see Get started with Oracle Cloud Infrastructure Free Tier.
- It uses example values for Oracle Cloud Infrastructure credentials, tenancy, and compartments. When completing your lab, substitute these values with ones specific to your cloud environment.
Monitor disk utilization using Oracle Cloud Infrastructure custom metrics
Introduction
Oracle Observability and Management platform services enable customers to monitor, analyze, and manage multicloud applications and infrastructure environments. It uses metrics to monitor resources and alarms to notify you when these metrics meet alarm-specified triggers. Metrics are emitted to the Monitoring service as raw data points, or timestamp-value pairs, along with dimensions and metadata.
Metrics come from a variety of sources:
- Resource metrics automatically posted by Oracle Cloud Infrastructure (OCI) resources. For example, CpuUtilization.
- Custom metrics published using the Monitoring API.
Objective
Monitor disk utilization using OCI custom metrics.
Prerequisites
-
Create Dynamic Group to add the required policy.
# Replace compartment_ocid as per your tenancy instance.compartment.id = '<compartment_ocid>' -
Add required policies to create namespace and provide permission to the user group to push metrics to the Monitoring service.
# Replace group-name as per your tenancy Allow dynamic-group <group-name> to use metrics in tenancy -
OCI Python SDK on compute instance.
# Using Oracle Linux 7 or 8 sudo yum install python36-oci-sdk -
SSH access to compute instance.
Task 1: Create the Python file
-
Create
disk_usage.pyin compute instance where disk utilization metric needs to be collected.Note: Use your preferred text editor based on the operating system.
-
Copy the below sample script to
disk_usage.py.# This is a sample python script to post disk utilization custom metric to oci monitoring. # Command: python disk_usage.py import oci,psutil,datetime from pytz import timezone # initialize service client with OCI python SDK signer = oci.auth.signers.InstancePrincipalsSecurityTokenSigner() monitoring_client = oci.monitoring.MonitoringClient(config={}, signer=signer, service_endpoint="https://telemetry-ingestion.ap-mumbai-1.oraclecloud.com") # get disk usage with psutil disk = psutil.disk_usage('/') disk_usage=disk.percent print(disk_usage) times_stamp = datetime.datetime.now(timezone('UTC')) # post custom metric to oci monitoring # replace "compartment_ocid“ with your compartmet ocid and srv01 with your compute instance post_metric_data_response = monitoring_client.post_metric_data( post_metric_data_details=oci.monitoring.models.PostMetricDataDetails( metric_data=[ oci.monitoring.models.MetricDataDetails( namespace="custom_metrics", compartment_id="your_compartment_ocid", name="disk_usage", dimensions={'resourceDisplayName': 'srv01'}, datapoints=[ oci.monitoring.models.Datapoint( timestamp=datetime.datetime.strftime( times_stamp,"%Y-%m-%dT%H:%M:%S.%fZ"), value=disk_usage)] )] ) ) # Get the data from response print(post_metric_data_response.data)Note: Refer psutil commands to extract more custom metrics.
-
Add execute permission to the script using the following command.
chmod +x disk_usage.py -
Update telemetry ingestion endpoint as per your region.
Note: Endpoints vary by operation. For posting metrics, use the telemetry-ingestion endpoints.
-
Update the namespace as per your requirement.
Note: For the metric namespace, don’t use a reserved prefix (oci_ or oracle_).
-
Update
compartment ocidwith your compartment ocid andsrv01with your compute instance. -
Add more metrics in script, if required to collect for same compute instance. Below is example to collect disk free space in GB.
# get metric details using psutil
disk_free=round(disk.free/1024/1024/1024,2)
print(disk_free)

# Add more metric to post if required
post_metric_data_response = monitoring_client.post_metric_data(
      post_metric_data_details=oci.monitoring.models.PostMetricDataDetails(
         metric_data=[
               oci.monitoring.models.MetricDataDetails(
                  namespace="custom_metrics",
                  compartment_id="your_compartment_ocid",
                  name="disk_free",
                  dimensions={'resourceDisplayName': 'srv01'},
                  datapoints=[
                     oci.monitoring.models.Datapoint(
                           timestamp=datetime.datetime.strftime(
                              times_stamp,"%Y-%m-%dT%H:%M:%S.%fZ"),
                           value=disk_free)]
                  )]
      )
   )
Task 2: Post custom metric data
-
Execute the script manually from CLI to validate the success.
python disk_usage.pyOutput: 27.1 { "failed_metrics": [], "failed_metrics_count": 0 } -
Schedule the script through cron job or scheduling task to post data frequently to OCI monitoring service.
-
Add the script details in the crontab using
crontab -eon non Windows compute instance.Note: custom metrics can be posted as frequently as every second and minimum aggregation interval is one minute. Best practice is to post custom metric every 1 minute or higher interval.
# Cron job example with every 1 min execution. */1 * * * * /usr/bin/python3 /home/opc/disk_usage.py -
Check the output in cron log using
sudo cat /var/log/cron | grep disk.
-
Task 3: View disk utilization metric using OCI metric explorer
-
Open the navigation menu and click Observability & Management.
-
Under Monitoring, click Metrics Explorer.
-
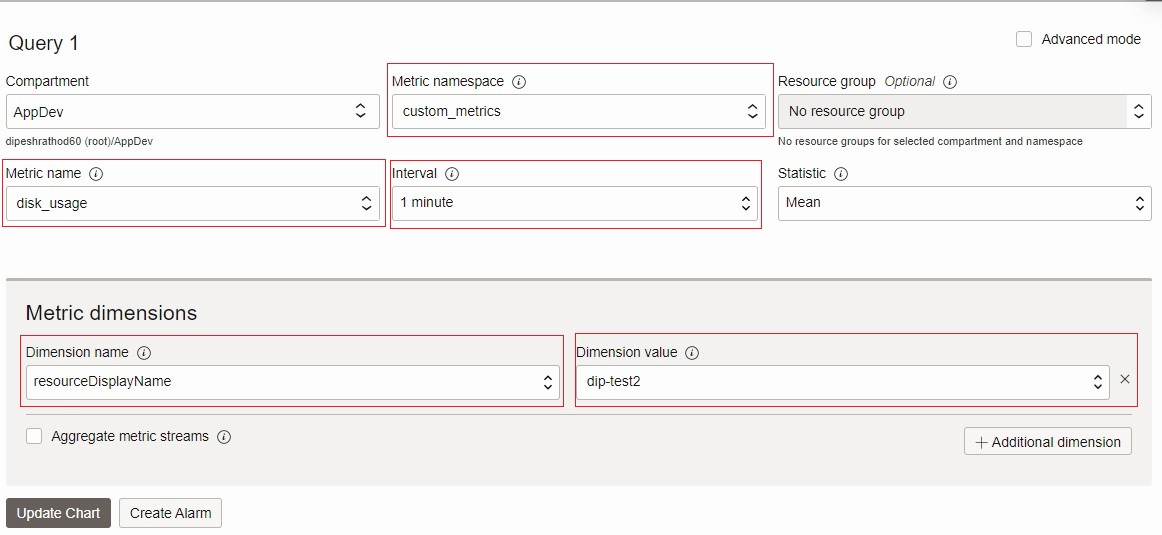
Choose the compartment that contains the custom metric that you want to view, and then click the name of the metric namespace. For example, custom_metrics.
-
Under Resources, click Metrics. Select metric name, interval and dimension name and dimension value.

-
Click Update Chart to view custom metric in Metrics Explorer.
Related Links
Acknowledgments
Author - Dipesh Kumar Rathod (Master Principal Cloud Architect, Infrastructure)
More Learning Resources
Explore other labs on docs.oracle.com/learn or access more free learning content on the Oracle Learning YouTube channel. Additionally, visit education.oracle.com/learning-explorer to become an Oracle Learning Explorer.
For product documentation, visit Oracle Help Center.
Monitor disk utilization using Oracle Cloud Infrastructure custom metrics
F86088-01
August 2023
Copyright © 2023, Oracle and/or its affiliates.