Note:
- This tutorial requires access to Oracle Cloud. To sign up for a free account, see Get started with Oracle Cloud Infrastructure Free Tier.
- It uses example values for Oracle Cloud Infrastructure credentials, tenancy, and compartments. When completing your lab, substitute these values with ones specific to your cloud environment.
Analyze Sample Logs with OCI Logging Analytics
Introduction
There are massive volumes of log telemetry in a typical enterprise environment. How do you find out if your log data has interesting log events? How do you correlate log events belonging to a specific business flow from across all your applications? How do you identify which business flows are behaving abnormally?
OCI Logging Analytics is a cloud solution that aggregates, indexes, and analyzes a variety of log data from on-premises and multicloud environments. It enables you to search, explore, and correlate this data, derive operational insights and make informed decisions. Logging Analytics can ingest, analyze and correlate logs from virtually any source. Correlation activities leverage both out-of-the-box applied machine learning as well as a sophisticated query language.
In this tutorial, learn how to use Oracle Cloud Infrastructure Logging Analytics to easily perform such tasks, including outlier detection, event clustering, log correlation and anomaly detection.
Objectives
Learn how to troubleshoot issues by analyzing log files leveraging pre-built machine learning algorithms, in-context and interactive dashboards to quickly pin-point problems and identify root-causes using OCI Logging Analytics.
Prerequisites
Note: You can use a trial account for this tutorial, however if you convert your account to “always free” you will be offboarded from the service and you will not be able to use it for this tutorial.
Prepare Your Environment
You must be an OCI Administrator and perform these steps within a single region.
Perform Generic Prerequisite Configuration Tasks to set up your Oracle Cloud Infrastructure tenancy and use Oracle Logging Analytics.
Enable Logging Analytics
If this is the first time using Logging Analytics in the current environment, you need to enable the service by performing the following steps. If you have enabled Logging Analytics, continue with the Upload Sample Logs section.
-
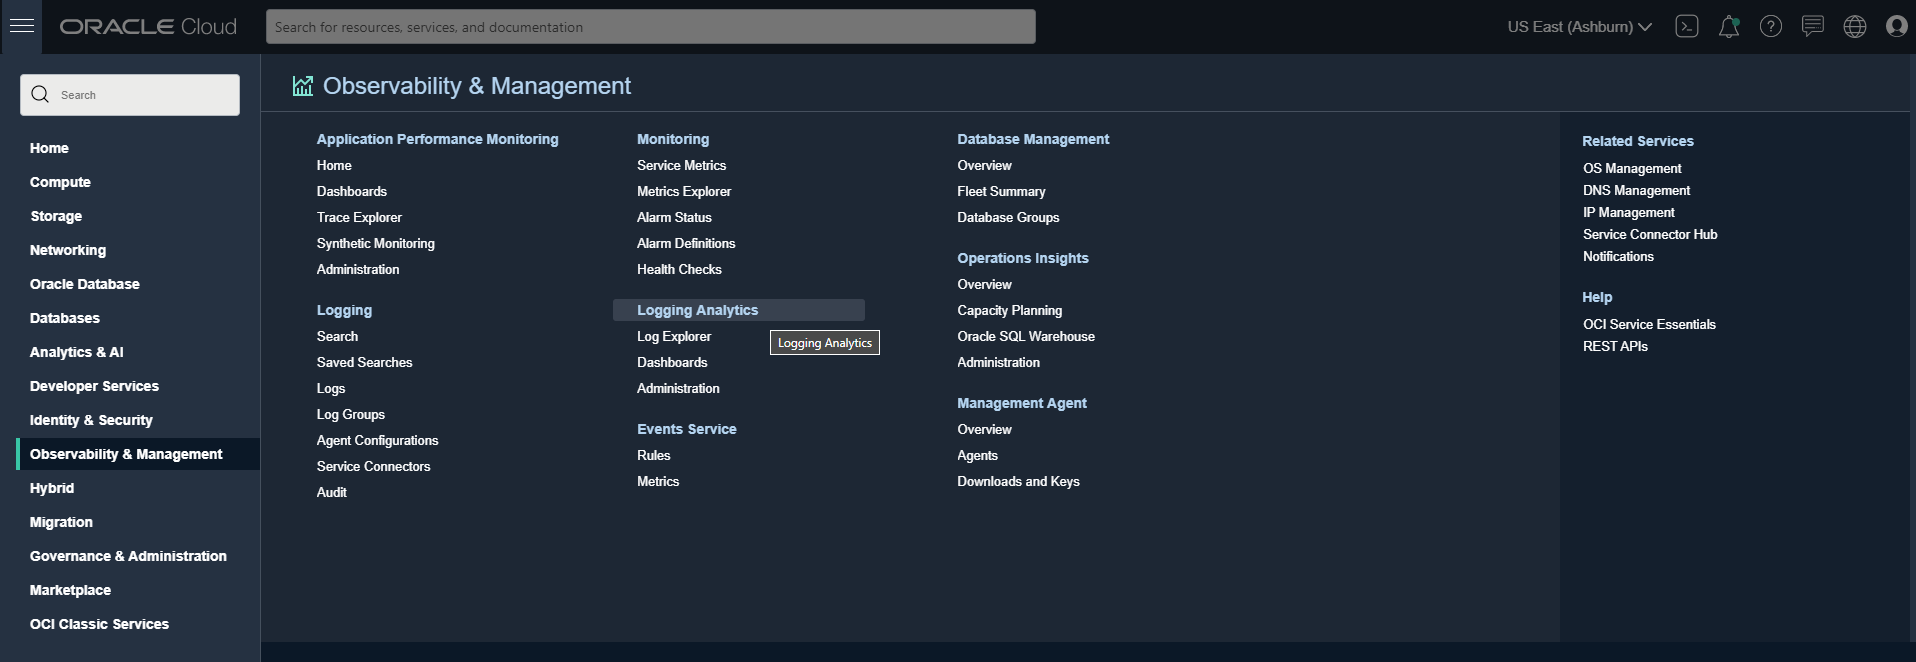
The Logging Analytics service is available from the top level OCI console menu. Navigate to Observability & Management and click Logging Analytics.
-
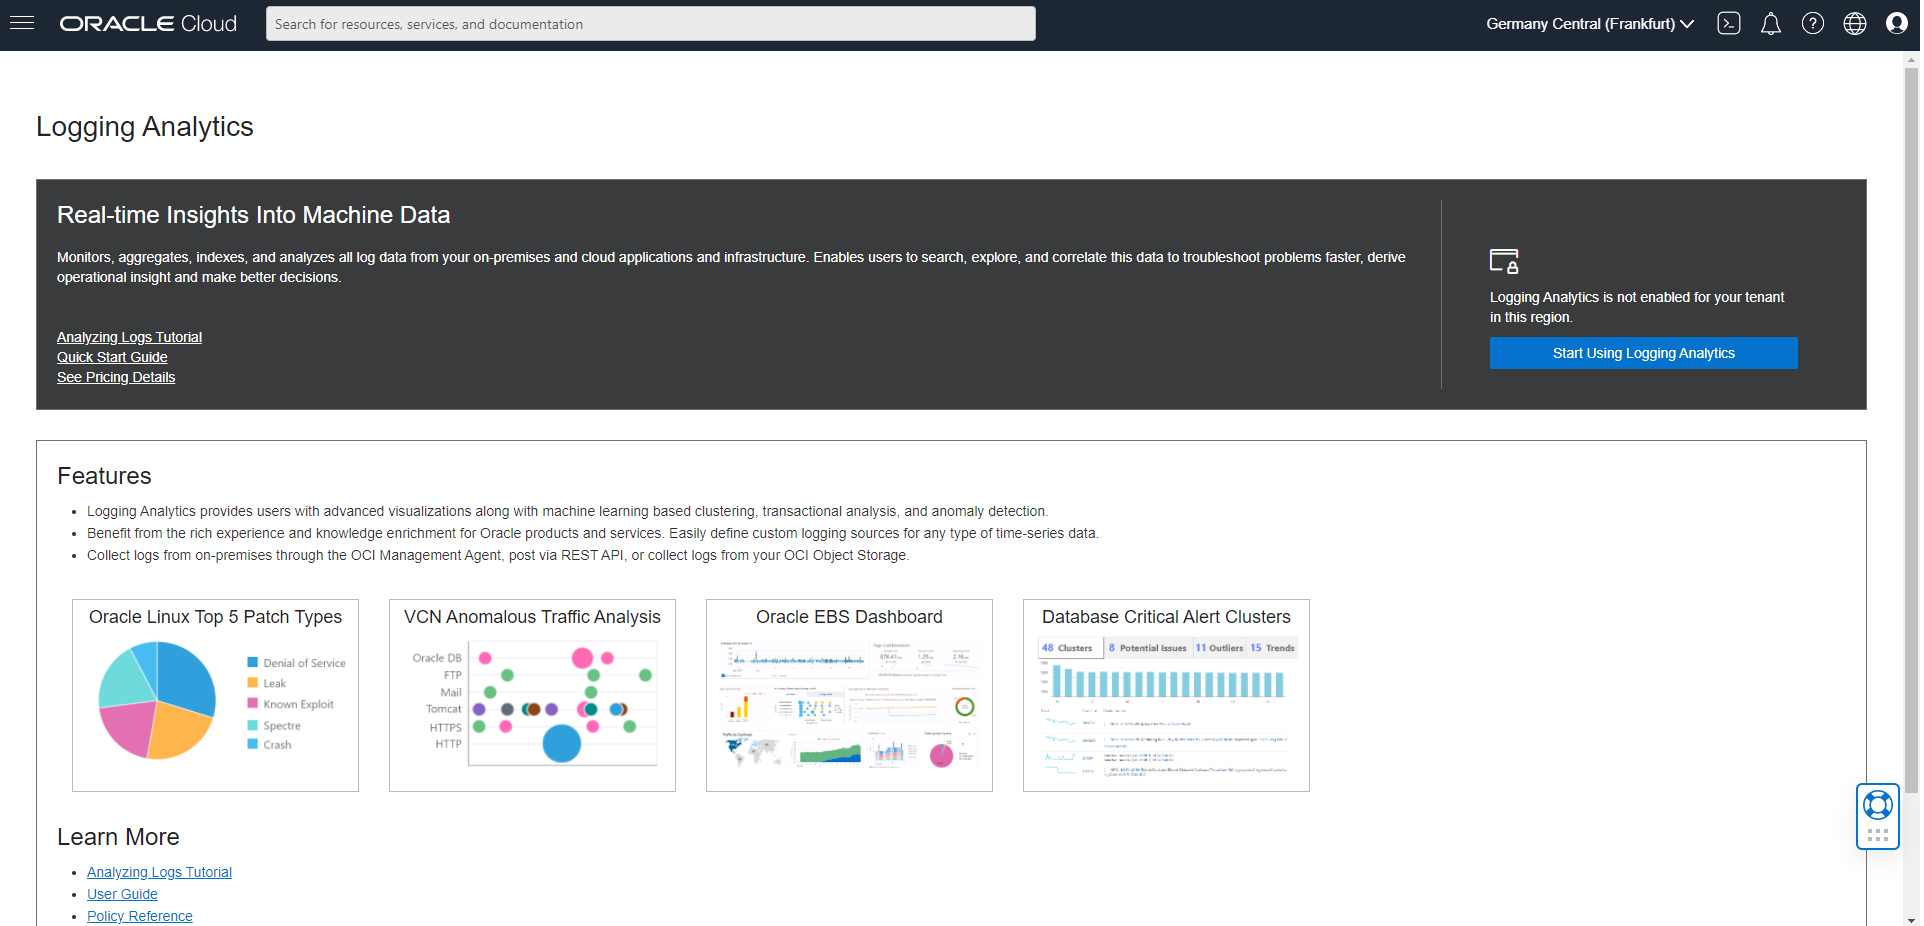
If this is the first time you’re using the service in this region, review the on-boarding page that will give you some high level details of the service and an option to Start Using Logging Analytics. Click Start Using Logging Analytics.
-
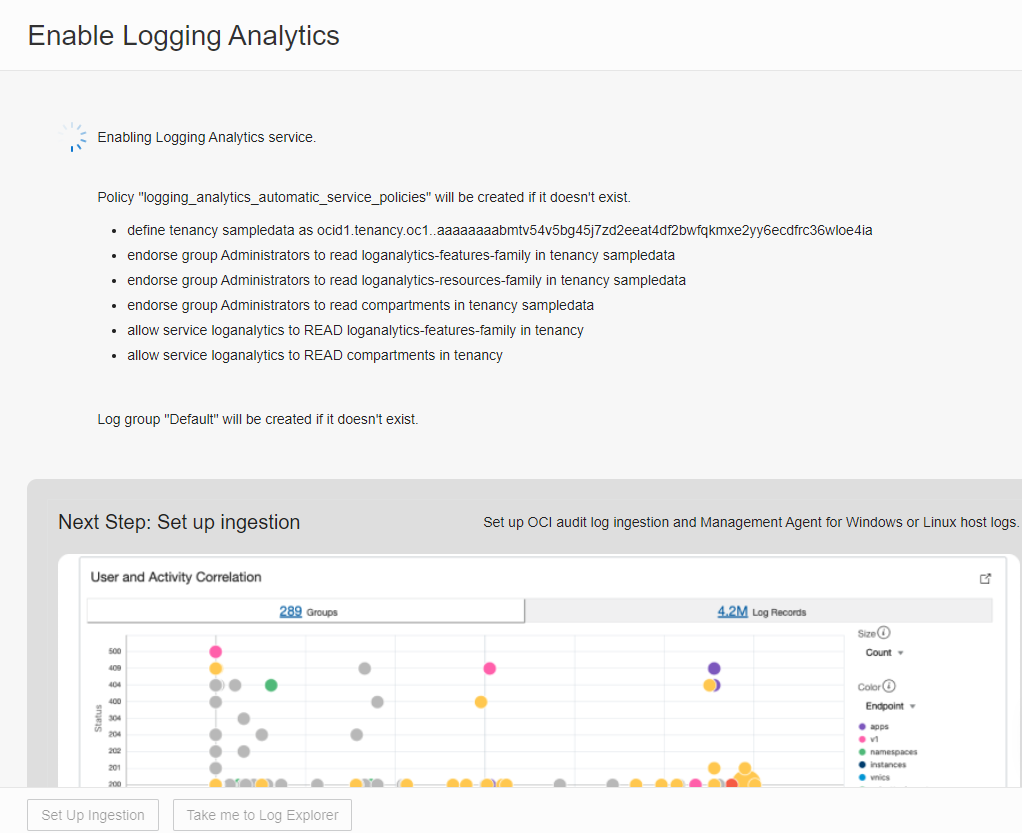
Review the policies that are automatically created. A log group called Default is created if it does not exist. After Logging Analytics service is enabled successfully, click Set Up Ingestion to continue.
-
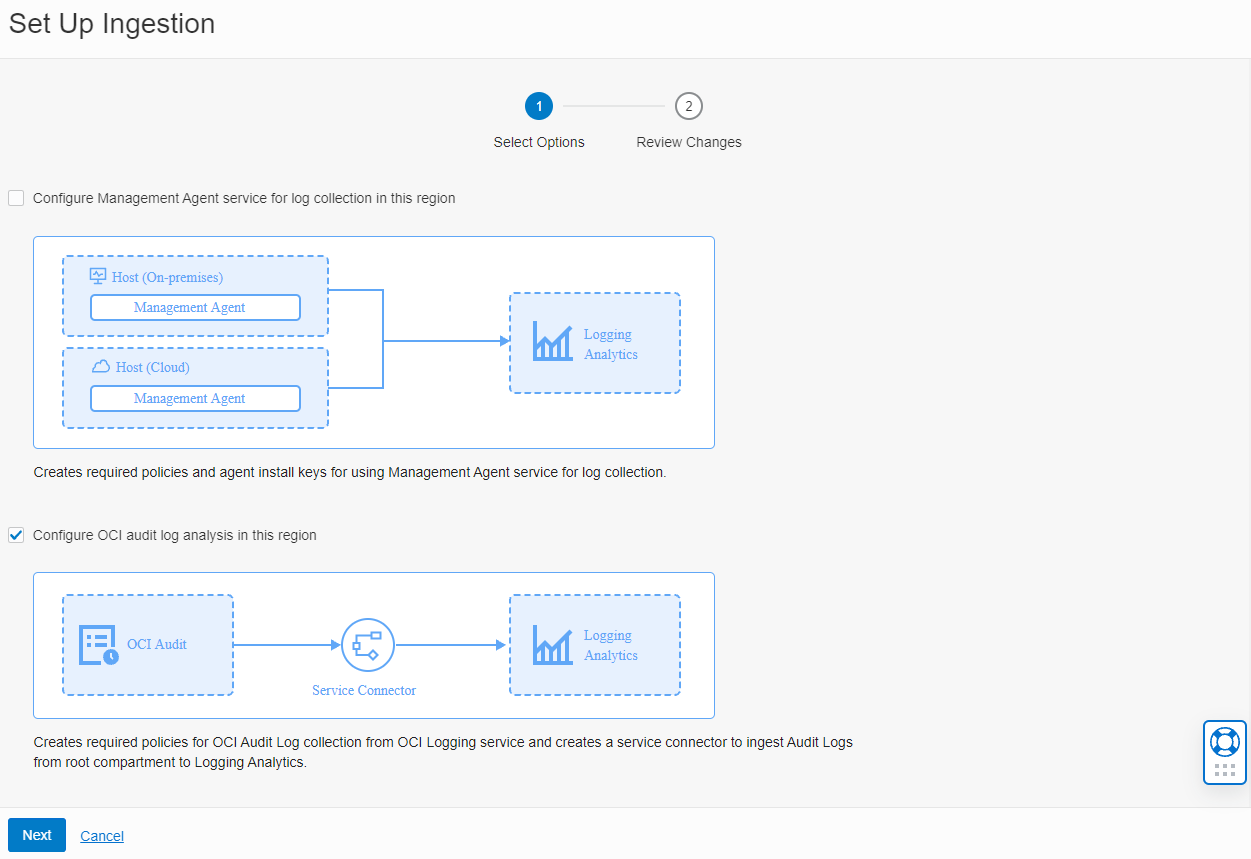
Select Configure OCI audit log analysis in this region, and click Next.
-
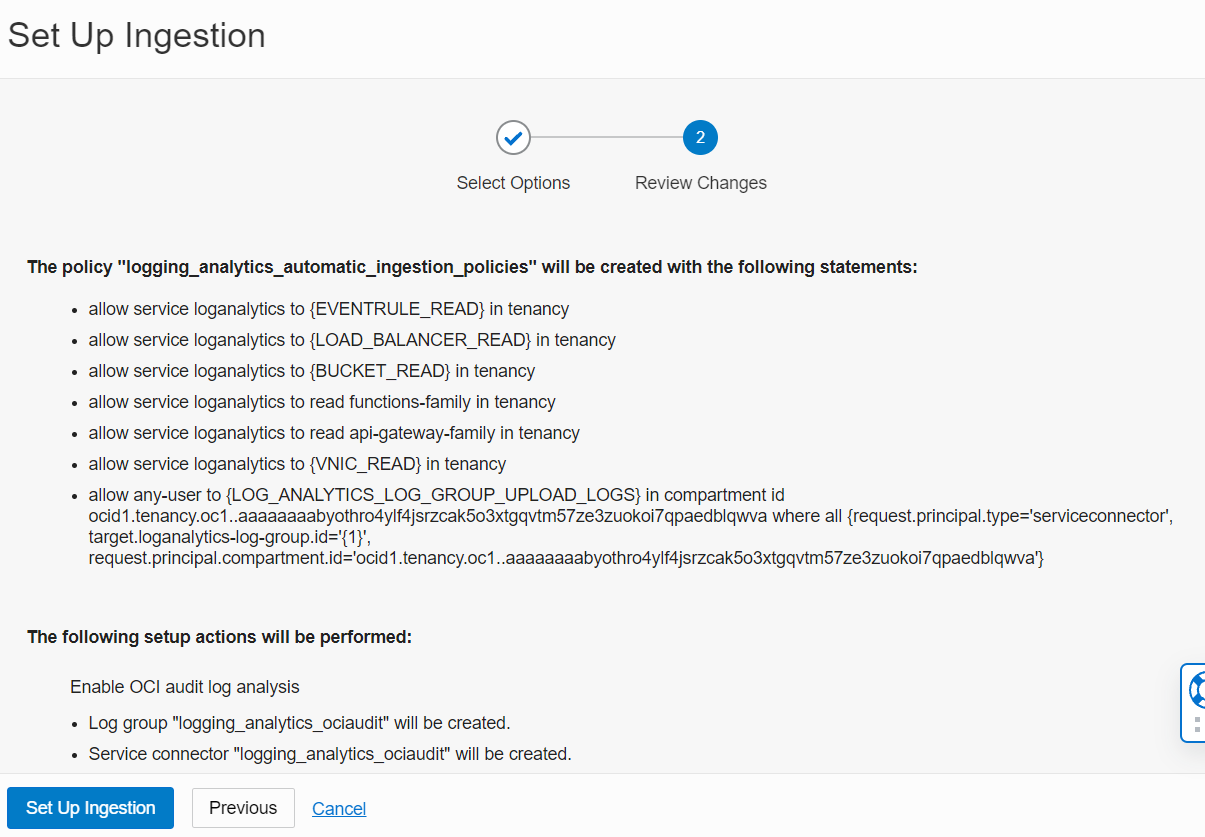
After reviewing the changes, click Set Up Ingestion.
-
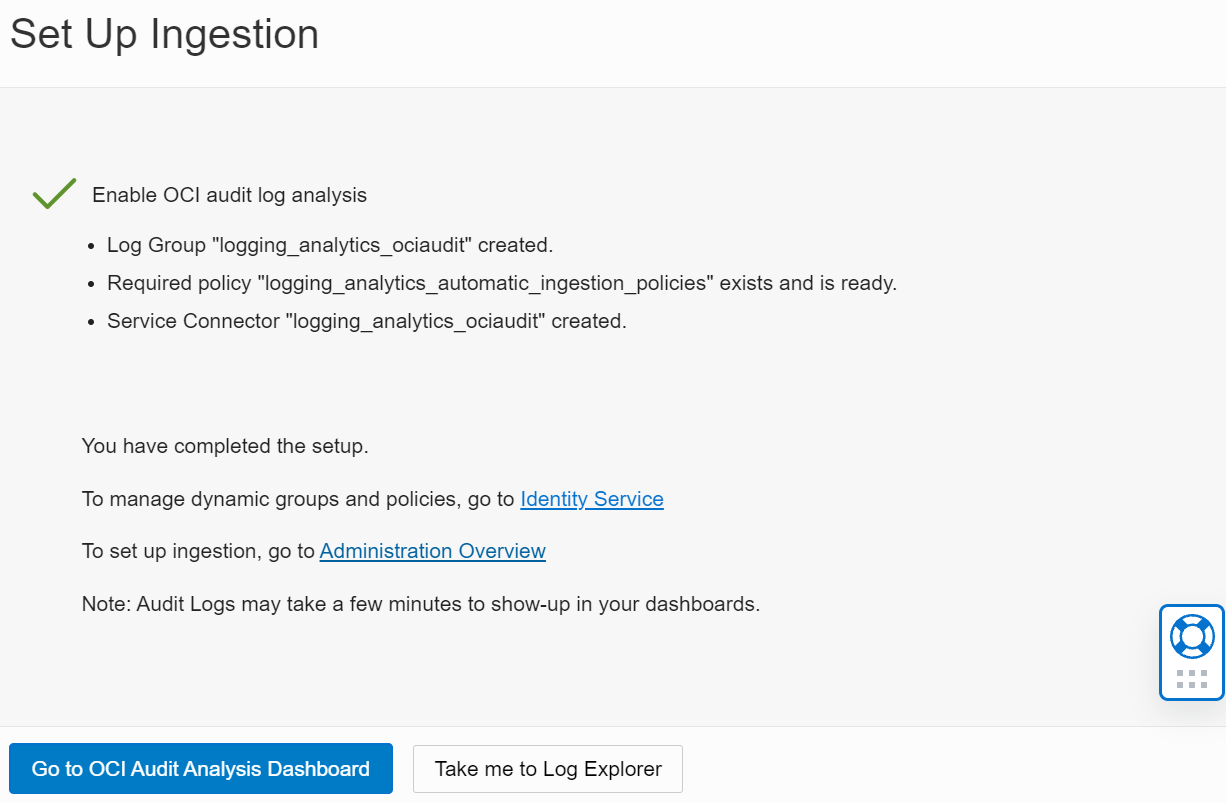
After the OCI Audit Logs Analysis is enabled successfully, click Go to OCI Audit Logs Dashboard.
Upload Sample Logs
-
Log into the OCI Console using your tenancy credentials.
-
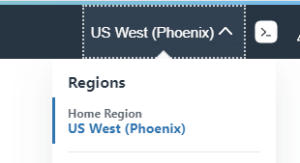
Ensure you are in your home region.
-
Open a Cloud Shell by clicking the icon to the right of the Region selector. The Cloud Shell will open in the bottom of your browser window and be available in a few minutes.
-
Run the following commands:
wget https://objectstorage.us-phoenix-1.oraclecloud.com/p/RHMd3hXQ4v33Bm7YE6IONjSvsNPFBNAf7BkcVgysjr9wgNA3gzZEB5DevHqkMR1t/n/ax1zffkcg1fy/b/oci_quick_start_script_do_not_delete/o/logging-analytics-demo-v1.0.zipunzip logging-analytics-demo-v1.0.zipcd logging-analytics-demo./setup.shSample Output for
./setup.shcommand:Running demo setup script: Jan-12-2021 Checking to see if compartment logging-analytics-demo already exists Does not exist yet, create compartment . . . Create log directories Update Log Record timestamps Loading files ... Processing source/cisco-asa (convert - I file(s)) - Cisco ASA Logs . . . Processed in 12 seconds Compressing files Uploading Logs . . . Uploading oci_api_gw_access.zip Uploading oci_api_gw_exec.zipThe setup script will set up all necessary OCI resources and load the sample log data.
Note: The setup script is re-runnable. If you have uploaded the same files before, click the navigation icon, click Observability & Management, navigate to Logging Analytics and click Administration. Under Resources click Uploads. Select
logging-analytics-demoand delete this upload before running the script again. When unziping, if asked to “replace”, reply with “A” ([A]ll).The setup script also creates a Super Administrators group called Logging-Analytics-SuperAdmins. To allow other OCI users to use Logging Analytics and analyze these sample logs, add these users to this group as follows:
a. From the OCI Console Menu, navigate to Identity > Users.
b. Click on the name of the user that will be using Logging Analytics
c. On the bottom half of the screen, click on the Add User to Group button.
d. In the dialog box, choose the Logging-Analytics-SuperAdmins group and click Add button to save your changes.
-
To verify that the sample log records have correctly been uploaded and that your environment is all setup, perform the following steps:
Verify the entities creation by clicking the navigation icon, click Observability & Management, navigate to Logging Analytics and click Administration. Under Resources click Entities. Select the
logging-analytics-democompartment. The list of entities should look like this: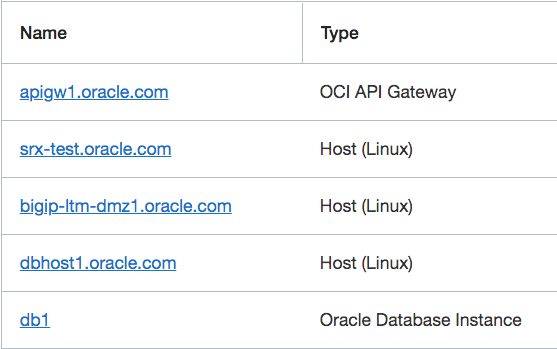
Verify the upload by navigating to Logging Analytics and click Administration. Under Resources click Uploads. Click on
logging-analytics-demo.Click Warnings on the left hand-side menu and confirm that there are no warnings or errors.
Next, navigate to Uploaded Files and click Status and select to filter by Failed. This should show no records. Change Status to In-Progress. This should show no records, indicating all the files were successfully uploaded.

Getting Familiar
-
Click View in Log Explorer on the left menu of the Uploaded Files page.
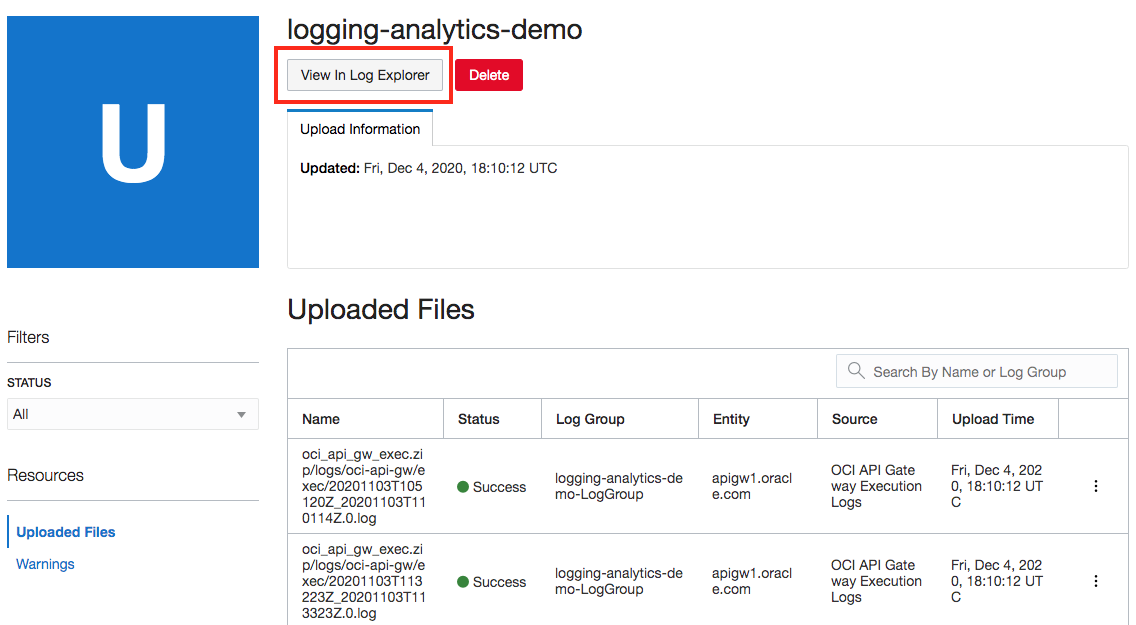
-
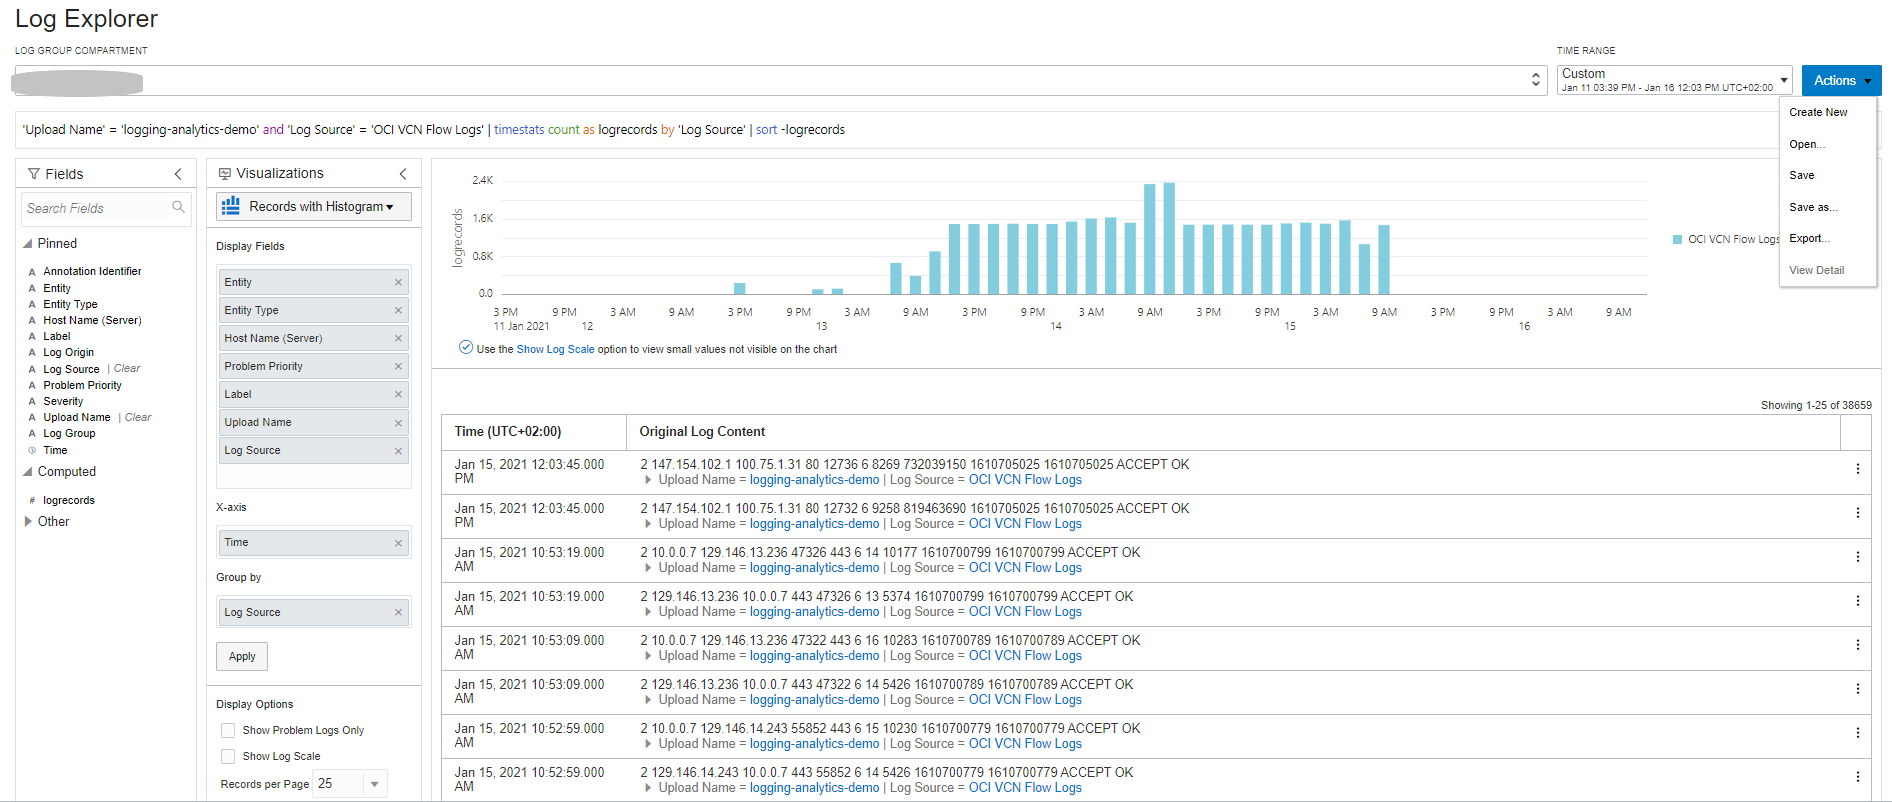
The following image presents the main parts of the user interface that will be used throughout this tutorial.

1) Query bar, with Clear, Search Help and Run buttons at the right end of the bar.
2) Time range menu, and Actions menu where you can find actions such as, Open, Save, and Save as.
3) Fields panel, where you can select sources and fields to filter your data.
4) Visualization panel, where you can select sources and fields to filter your data.
5) Main panel, where the visualization outputs appear above the results of the query.
-
The time range should remain “Custom” for the throughout the tutorial. If the time range cannot be reset to “Custom” you can restart by going back to the “Uploaded Files” page and clicking View in Log Explorer.
HINT: If you lose a step, you can use the browser back button. However, please refrain to use the refresh button.
Explore Logs Using Clustering
-
Click on OCI VCN Flow Logs to drill down into VCN flow data.

-
Navigate to Actions and click Save-As to save this search as a “Widget”.
-
Complete the “Save Search” and click Save.
At this time the widget can be added to a dashboard directly from here, or later from the dashboard menu.

-
Create a couple of more widgets by viewing the various others logs.
You will later be adding them to a dashboard.
-
Return to viewing all your logs data.
Hint: Clear the query bar and click Run.
You are working with ~74k total records. It is easier to visualize large volume of data as related clusters. Logging Analytics - Clustering (Unsupervised ML) uses the log data and the enriched domain expertise to find patterns in the data. Clustering works on text as well as numbers, allowing large volume of data to be reduced to fewer patterns for anomaly detection. Click on the Cluster button in the visualization panel.
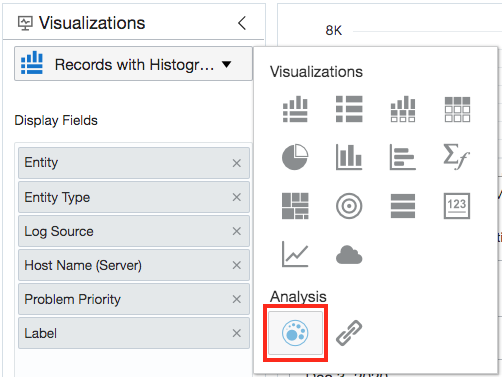
-
Drill down into different clusters, potential issues, outliers and trends.
Logging Analytics uses unsupervised ML to find related clusters in data. This reduces the ~74k logs to 629 cluster patterns, in real time.
Note: The numbers you see might be slightly different than the ones shown in the tutorial.

-
Click on the Potential Issues tab.
Out of the 629 clusters, 76 were automatically identified as Potential Issues.

-
Click on Outliers tab.
These issues occurred only once, and indicate an anomaly in the system.

-
Now, click on Trends tab.
These are cluster patterns that are correlated in time. Click on 8 Similar Trends to see a set of related logs from the Database Alert Logs. Note that the exact number of displayed trends may vary based on the selected time window.

-
Save this search following the same steps you performed above in Step 3.
-
Create one more visualization to understand the distribution of your network traffic.
First change visualization to Pie and select a new set of data,
OCI VCN Flow Logs.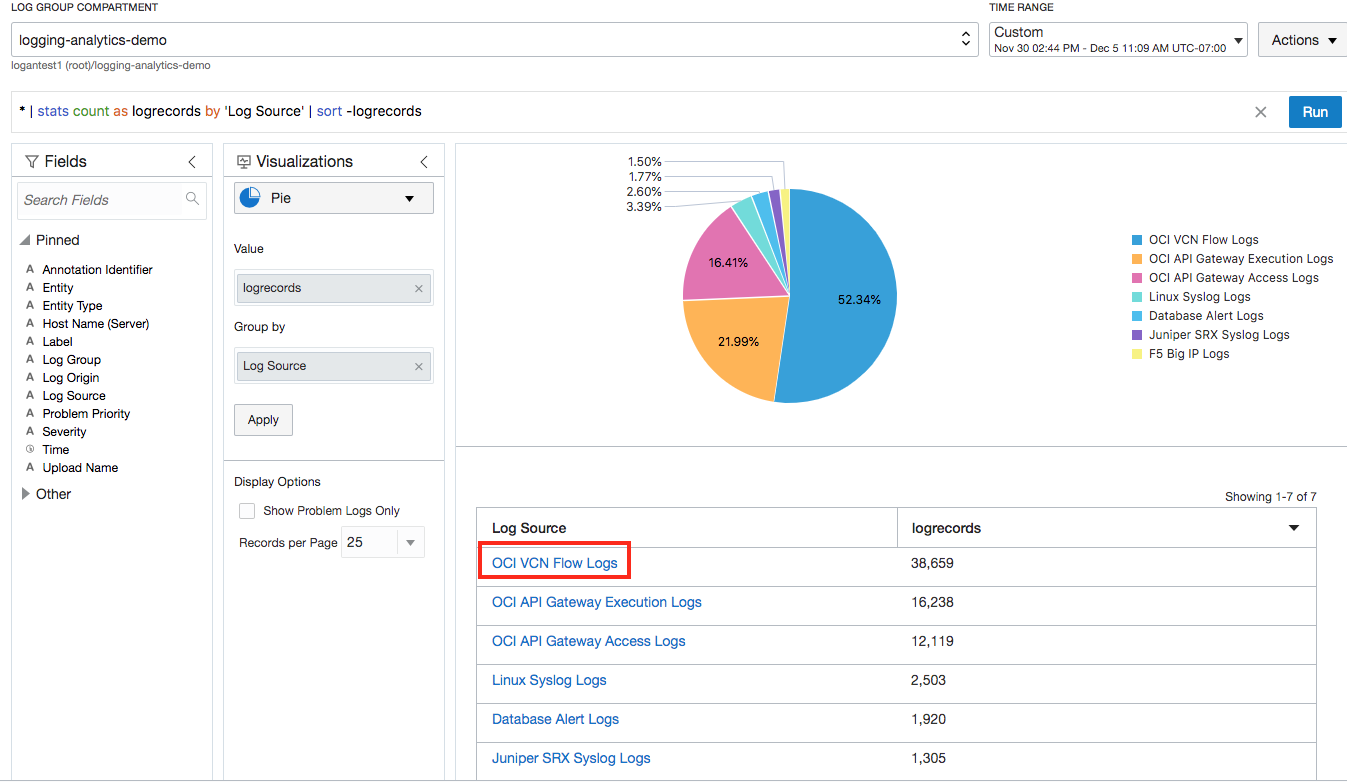
In the search box from the Fields Panel search for the string “Source”. Then, drag and drop “Source IP” from the ”Other” to the “Group by” box in the Visualization Panel and click Apply.
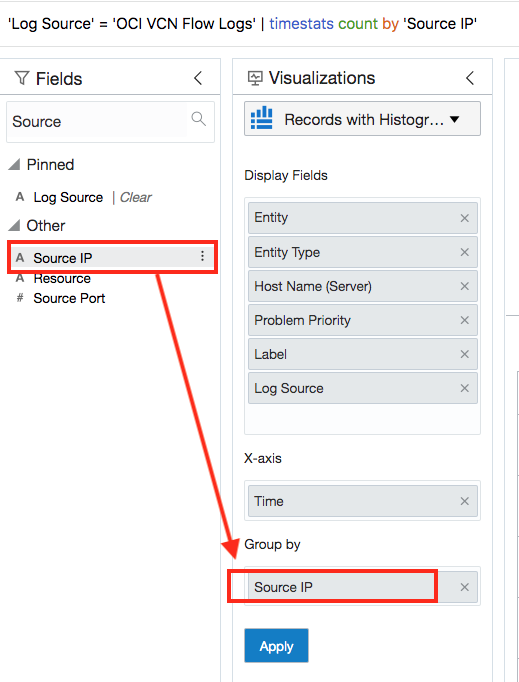
Here, you can see the log distribution by “Source IP”.

-
Find the distribution of “Destination IPs” using the query language.
Enter the following query in the query bar and click Run.
'Log Source' = 'OCI VCN Flow Logs’ | stats count('Destination IP') by 'Destination IP'
A Pie chart (as set by default) with records is shown.

-
Change the visualization to a tree map by selecting “Tree map” from the visualization menu.
Select “Tree map”
 from the visualization menu.
On this page you can visualize the Destination-IPs distribution. Save As this search/widget.

Explore Logs Using “Link”
-
Correlate data with other data sources using the unsupervised Link feature. Enter the following in the query bar and click Run.
Hint: Press Ctrl-I in the query bar to format the query.
'Upload Name' = 'logging-analytics-demo' and 'Log Source' = 'OCI VCN Flow Logs'
| eval 'Source Name' = if('Source Port' = 80,
                       HTTP,
                       'Source Port' = 443,
                       HTTPS,
                       'Source Port' = 21,
                       FTP,
                       'Source Port' = 22,
                       SSH,
                       'Source Port' = 137,
                       NetBIOS,
                       'Source Port' = 648,
                       RRP,
                       'Source Port' = 9006,
                       Tomcat,
                       'Source Port' = 9042,
                       Cassandra,
                       'Source Port' = 9060,
                       'Websphere Admin. Console',
                       'Source Port' = 9100,
                       'Network  Printer',
                       'Source Port' = 9200,
                       'Elastic Search',
                       Other)
 | eval 'Destination Name' = if('Destination Port' = 80,
                            HTTP,
                            'Destination Port' = 443,
                            HTTPS,
                            'Destination Port' = 21,
                            SSH,
                            'Destination Port' = 22,
                            FTP,
                            'Destination Port' = 137,
                            NetBIOS,
                            'Destination Port' = 648,
                            RRP,
                            'Destination Port' = 9006,
                            Tomcat,
                            'Destination Port' = 9042,
                            Cassandra,
                            'Destination Port' = 9060,
                            'Websphere Admin. Console',
                            'Destination Port' = 9100,
                            'Network  Printer',
                            'Destination Port' = 9200,
                            'Elastic Search',
                            Other)
 | eval Source = 'Source IP' || ':' || 'Source Port'
 | eval Destination = 'Destination IP' || ':' || 'Destination Port'
 | link Source,
    Destination
 | stats avg('Content Size Out') as 'Transfer Size (bytes)',
    unique('Source Name') as 'Traffic From',
    unique('Destination Name') as 'Traffic To'
 | classify topcount = 300 correlate = -*,
    Source,
    Destination 'Start Time',
    'Traffic From',
    'Transfer Size (bytes)',
    'Traffic To' as Network
The eval functionality translates the Port names to Applications.
The last part of the query adds more query time evaluation fields, which create a unique row for each Source and Destination, and compute the average network transfer between these end points. In addition, you also get a translated name for the Source and Destination ports as ‘Traffic From’ and ‘Traffic To’.
-
Navigate to Analyze, click Create Chart and fill in the fields as shown below:

-
Analyze clusters and analyzes the specified data points, creating the below analysis:

-
You can chose different fields to control the size and colors of the items on the chart.

-
Hover over items to see detail information about them.

-
You can click on items to have access to its contents.

-
Save this as a widget.
Navigate to Options and click Display Options. In the ‘Dashboard Options’ section of the panel, uncheck all options, and check only ‘Analyze’ and ‘Data Table’. Click Save Changes. Then, navigate to Actions and click Save As to save this analysis as a widget.
Create Dashboards
-
Navigate to Logging Analytics and click Dashboards.

-
Click Create.
Enter a dashboard name, the compartment previously created (logging-analytics-demo) and use the saved searches available as widgets for the dashboard on the right side. Drag and drop a widget on the canvas. The panels can be sized and moved on the canvas. Add other widgets created earlier. You dashboard may look something like this:

Or, like this:

Learn More
To continuously collect log data from your on-premises entities, you can install Management Agents on your hosts, on-premises or in a cloud infrastructure. See details under Use Oracle Management Agents.
For more info on Entity Associations used to create relationships, see:
Configure New Source-Entity Association
Entity Types Modeled in Logging Analytics
For other technical information, see Logging Analytics.
Explore other labs on Oracle Learn or access more free learning content on the Oracle Learning YouTube channel. Additionally, visit Oracle University to become an Oracle Learning Explorer.
More Learning Resources
Explore other labs on docs.oracle.com/learn or access more free learning content on the Oracle Learning YouTube channel. Additionally, visit education.oracle.com/learning-explorer to become an Oracle Learning Explorer.
For product documentation, visit Oracle Help Center.
Analyze Sample Logs with OCI Logging Analytics Tutorial
F37611-04
November 2021
Copyright © 2021, Oracle and/or its affiliates.