Monitor an Oracle Cloud Infrastructure Database with PostgreSQL using Prometheus and Grafana
Introduction
PostgreSQL is one of the most popular databases among application developers. Beyond the management overhead elimination that Oracle Cloud Infrastructure Database with PostgreSQL (OCI Database with PostgreSQL) offers, it also goes a step further when it comes to implementing an ease of monitoring. Prometheus and Grafana are a very popular pair when it comes to monitoring application performance for time-series data storage and visualization respectively.
In this tutorial, we will demonstrate how to monitor an OCI Database with PostgreSQL by extracting query-level metrics using the PostgreSQL Exporter, scraping them with Prometheus, visualizing them in Grafana, and setting up alerts for bloat metrics.
Architecture Overview
The following schema depicts the overall approach. The following components are used:
- OCI Database with PostgreSQL.
- Postgres Exporter to expose metrics.
- Prometheus to scrape metrics.
- Grafana to visualize metrics.
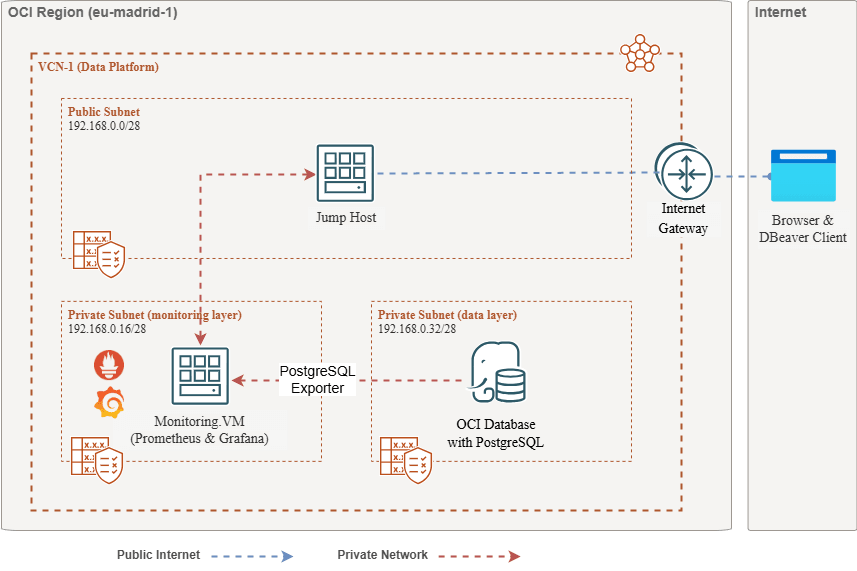
Note: While the architecture displays three subnets for clarity, this tutorial uses only two, and the jump host is also the VM used to deploy Prometheus and Grafana.
Objectives
-
Extract PostgreSQL metrics with the PostgreSQL Exporter for Prometheus.
-
Ingest those metrics in Prometheus.
-
Visualize the metrics using Grafana dashboards.
-
Set up alerts to detect table bloat using metrics exposed through the PostgreSQL Exporter.
Prerequisites
-
Access to an OCI tenancy with a provisioned OCI Database with PostgreSQL cluster. For more information, see Connect to Oracle Cloud Infrastructure Database with PostgreSQL using DBeaver.
-
OCI Compute instance (jump host) in a public subnet in the same VCN as the OCI Database with PostgreSQL.
-
OCI Security List: Allow inbound ports
9090,9187,3000. -
Run the following commands to set up the firewall on instance.
sudo firewall-cmd --permanent --add-port=9090/tcp
sudo firewall-cmd --permanent --add-port=9187/tcp
sudo firewall-cmd --permanent --add-port=3000/tcp
sudo firewall-cmd --reload
Task 1: Enable Monitoring Extensions on OCI Database with PostgreSQL
-
Enable the
pg_stat_statementsExtension.Add
pg_stat_statementson the OCI Database with PostgreSQL configurations through OCI Console. For more information, see Enabling Extensions for a Database. -
Create Monitoring User.
Run the following queries to create and connect user using DBeaver through jump host.
CREATE USER postgres_exporter WITH PASSWORD '<password>';
GRANT CONNECT ON DATABASE postgres TO postgres_exporter;
GRANT pg_monitor TO postgres_exporter;
Note:
pg_stat_ioextension is available from OCI Database with PostgreSQL v16 onwards.
Task 2: Install the PostgreSQL Exporter for Prometheus
Note: Run the following commands on your OCI Compute instance.
-
Install PostgreSQL Exporter.
wget https://github.com/prometheus-community/postgres_exporter/releases/download/v0.15.0/postgres_exporter-0.15.0.linux-amd64.tar.gz tar -xvf postgres_exporter-0.15.0.linux-amd64.tar.gz sudo mv postgres_exporter-0.15.0.linux-amd64/postgres_exporter /usr/local/bin/ -
Create Custom
queries.yaml.nano queries.yaml# Custom PostgreSQL Query Metrics for Postgres Exporter # Top 5 slowest SQL statements top_sql_statements: query: > SELECT query, calls, total_exec_time + total_plan_time AS total_time FROM pg_stat_statements ORDER BY total_time DESC LIMIT 5; metrics: - query: usage: "LABEL" description: "SQL query text" - calls: usage: "COUNTER" description: "Number of executions" - total_time: usage: "GAUGE" description: "Total execution + plan time" # 2. Top users by total execution time top_sql_users: query: > SELECT usename, SUM(total_exec_time + total_plan_time) AS total_exec_time FROM pg_stat_statements JOIN pg_user ON pg_stat_statements.userid = pg_user.usesysid GROUP BY usename ORDER BY total_exec_time DESC LIMIT 5; metrics: - usename: usage: "LABEL" description: "PostgreSQL user" - total_exec_time: usage: "GAUGE" description: "Total execution time by user" # 3. Top client IPs by connection count top_clients: query: > SELECT client_addr, COUNT(*) AS connections FROM pg_stat_activity WHERE client_addr IS NOT NULL GROUP BY client_addr ORDER BY connections DESC LIMIT 5; metrics: - client_addr: usage: "LABEL" description: "Client IP address" - connections: usage: "GAUGE" description: "Number of active connections" # 4. Currently running queries by user and IP active_queries_by_user_ip: query: > SELECT usename, client_addr, COUNT(*) as active_queries FROM pg_stat_activity WHERE state = 'active' GROUP BY usename, client_addr; metrics: - usename: usage: "LABEL" description: "User running queries" - client_addr: usage: "LABEL" description: "Client IP address" - active_queries: usage: "GAUGE" description: "Number of currently active queries" # 5. Query frequency (most called) frequent_sql: query: > SELECT query, calls FROM pg_stat_statements ORDER BY calls DESC LIMIT 5; metrics: - query: usage: "LABEL" description: "SQL query text" - calls: usage: "COUNTER" description: "Number of executions" # 6. Table bloat statistics table_bloat: query: > SELECT current_database() AS current_db, schemaname AS schema_name, tblname AS table_name, (bs * tblpages) / 1024 AS actual_table_size_kb, ((tblpages - est_tblpages) * bs) / 1024 AS wasted_space_kb, CASE WHEN tblpages > 0 AND tblpages - est_tblpages > 0 THEN 100 * (tblpages - est_tblpages) / tblpages::float ELSE 0 END AS wasted_space_percent, fillfactor AS table_fill_factor, CASE WHEN tblpages - est_tblpages_ff > 0 THEN (tblpages - est_tblpages_ff) * bs / 1024 ELSE 0 END AS bloat_size_kb, CASE WHEN tblpages > 0 AND tblpages - est_tblpages_ff > 0 THEN 100 * (tblpages - est_tblpages_ff) / tblpages::float ELSE 0 END AS bloat_size_percent FROM ( SELECT ceil(reltuples / ((bs - page_hdr) / tpl_size)) + ceil(toasttuples / 4) AS est_tblpages, ceil(reltuples / ((bs - page_hdr) * fillfactor / (tpl_size * 100))) + ceil(toasttuples / 4) AS est_tblpages_ff, tblpages, fillfactor, bs, schemaname, tblname FROM ( SELECT (4 + tpl_hdr_size + tpl_data_size + (2 * ma) - CASE WHEN tpl_hdr_size % ma = 0 THEN ma ELSE tpl_hdr_size % ma END - CASE WHEN ceil(tpl_data_size)::int % ma = 0 THEN ma ELSE ceil(tpl_data_size)::int % ma END ) AS tpl_size, (heappages + toastpages) AS tblpages, reltuples, toasttuples, bs, page_hdr, schemaname, tblname, fillfactor, ma, tpl_hdr_size, tpl_data_size FROM ( SELECT ns.nspname AS schemaname, tbl.relname AS tblname, tbl.reltuples, tbl.relpages AS heappages, COALESCE(toast.relpages, 0) AS toastpages, COALESCE(toast.reltuples, 0) AS toasttuples, COALESCE(substring(array_to_string(tbl.reloptions, ' ') FROM 'fillfactor=([0-9]+)')::smallint, 100) AS fillfactor, current_setting('block_size')::numeric AS bs, CASE WHEN version() ~ 'mingw32|64-bit|x86_64|ppc64|ia64|amd64' THEN 8 ELSE 4 END AS ma, 24 AS page_hdr, 23 + CASE WHEN MAX(COALESCE(s.null_frac, 0)) > 0 THEN (7 + count(s.attname)) / 8 ELSE 0 END + CASE WHEN bool_or(att.attname = 'oid' AND att.attnum < 0) THEN 4 ELSE 0 END AS tpl_hdr_size, SUM((1 - COALESCE(s.null_frac, 0)) * COALESCE(s.avg_width, 0)) AS tpl_data_size FROM pg_attribute AS att JOIN pg_class AS tbl ON att.attrelid = tbl.oid JOIN pg_namespace AS ns ON ns.oid = tbl.relnamespace LEFT JOIN pg_stats AS s ON s.schemaname = ns.nspname AND s.tablename = tbl.relname AND s.attname = att.attname LEFT JOIN pg_class AS toast ON tbl.reltoastrelid = toast.oid WHERE NOT att.attisdropped AND tbl.relkind IN ('r', 'm') GROUP BY 1, 2, 3, 4, 5, 6, 7, 8, 9 ) AS inner_subquery ) AS mid_subquery ) AS bloat_subquery WHERE schemaname = 'public' ORDER BY schema_name, table_name; metrics: - schema_name: usage: "LABEL" description: "Schema name" - table_name: usage: "LABEL" description: "Table name" - bloat_size_kb: usage: "GAUGE" description: "Bloat size in KB" - bloat_size_percent: usage: "GAUGE" description: "Bloat size as a percentage" -
Set the Data Source Environment Variable.
export DATA_SOURCE_NAME="postgresql://postgres_exporter:<password>@<POSTGRES_HOST>:5432/postgres?sslmode=require"Note:
<POSTGRES_HOST>is the primary endpoint FQDN. You can find it in the PostgreSQL cluster details page in the OCI Console. -
Start the PostgreSQL Exporter.
Run the PostgreSQL Exporter with the custom
queries.yamlfile using the following command. This starts the exporter on port9187and logs output toexporter.log.nohup /usr/local/bin/postgres_exporter --extend.query-path=/home/opc/queries.yaml --web.listen-address=":9187" > exporter.log 2>&1 &Note: To keep things running after reboot, consider setting up the service using systemd
-
Verify the Exporter.
curl http://localhost:9187/metrics
Task 3: Install and Configure Prometheus
-
Install Prometheus.
wget https://github.com/prometheus/prometheus/releases/download/v2.52.0/prometheus-2.52.0.linux-amd64.tar.gz tar -xvf prometheus-2.52.0.linux-amd64.tar.gz sudo mv prometheus-2.52.0.linux-amd64/prometheus /usr/local/bin/ sudo mv prometheus-2.52.0.linux-amd64/promtool /usr/local/bin/ -
Create Prometheus Config.
Create
/etc/prometheus/prometheus.ymlfile with the following content.global: scrape_interval: 15s scrape_configs: - job_name: 'postgres_exporter' static_configs: - targets: ['127.0.0.1:9187'] -
Start Prometheus.
nohup prometheus --config.file=/etc/prometheus/prometheus.yml > prometheus.log 2>&1 &Note: To keep things running after reboot, consider setting up the service using systemd
-
Verify Targets.
Visit here:
http://<instance_ip>:9090/targets.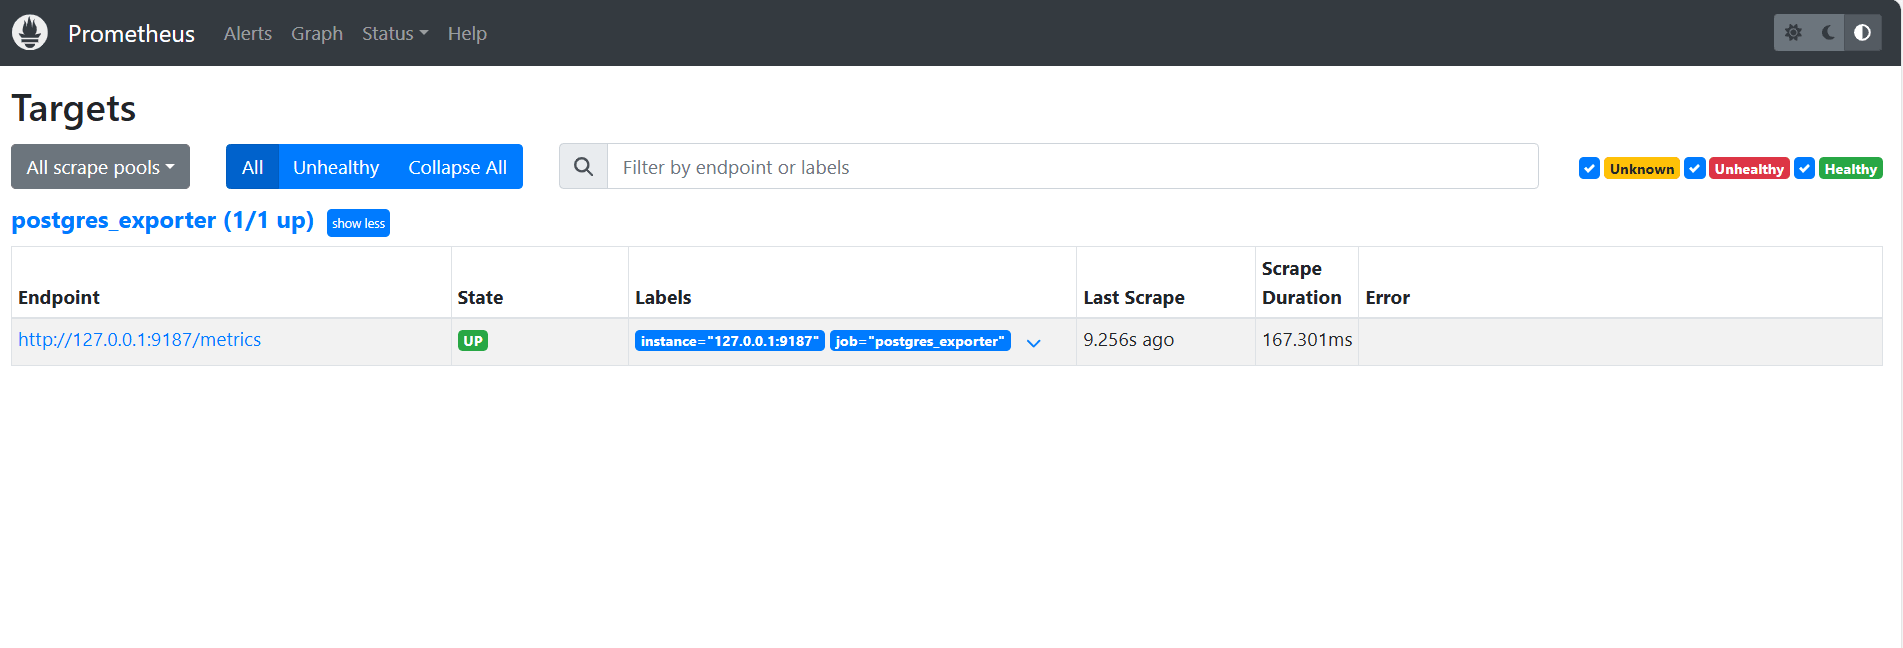
Task 4: Install and Configure Grafana
-
Install Grafana.
sudo yum install -y https://dl.grafana.com/oss/release/grafana-10.4.2-1.x86_64.rpm sudo systemctl enable grafana-server sudo systemctl start grafana-server -
Log in to Grafana.
Go to the following URL:
http://<instance_ip>:3000and enter Username asadminand Password asadmin. -
Add the Data Source in Grafana.
-
Go to Connections, Data Sources and click Add data source.
-
Select Prometheus.
-
Enter URL as
http://localhost:9090.

-
-
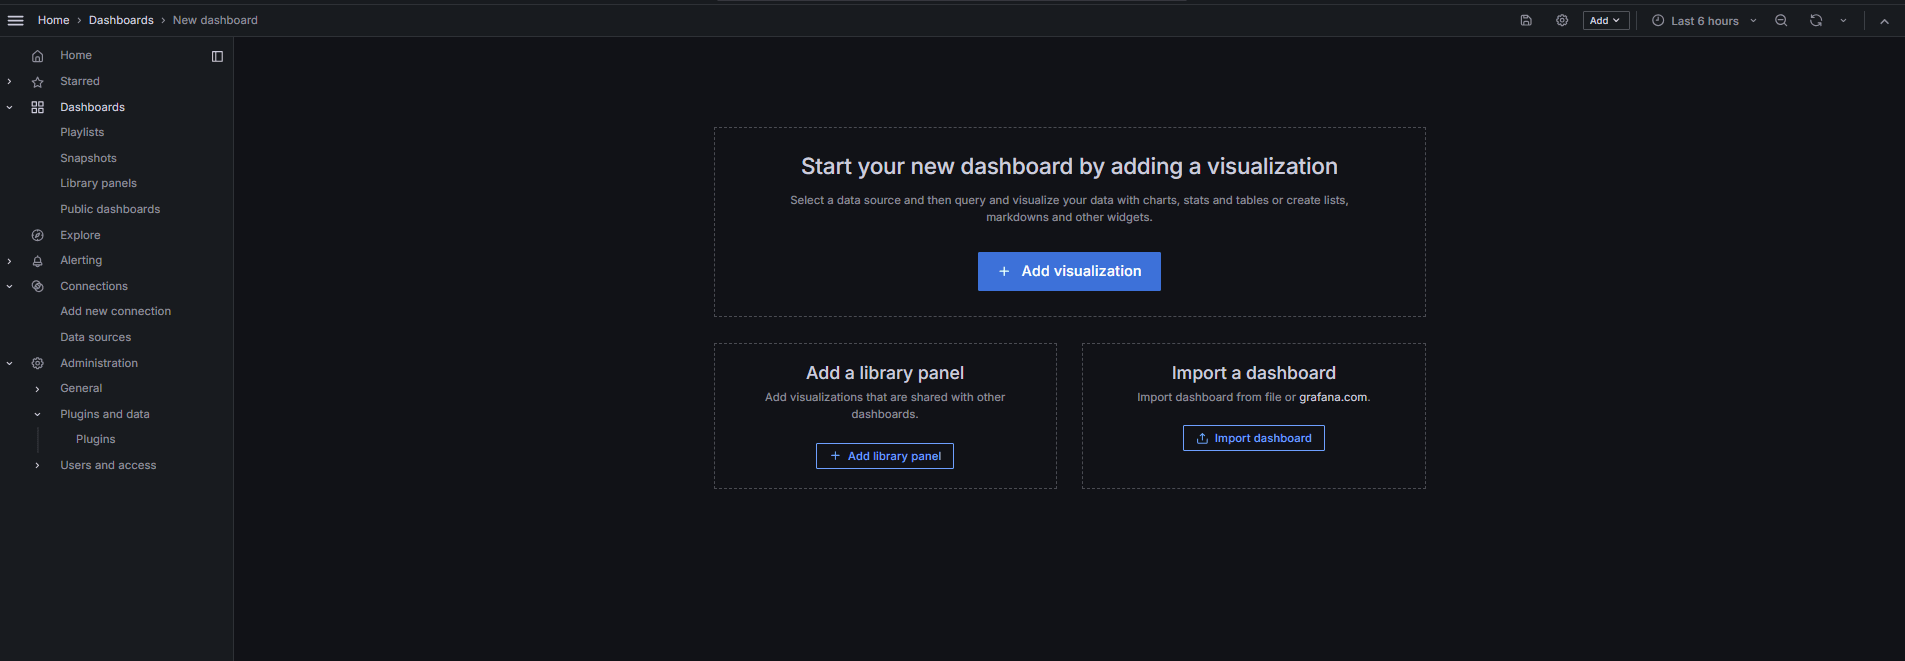
Import PostgreSQL Dashboard.
-
Select Import a dashboard.
-
Import 9628 dashboard ID from Grafana dashboards.
-
Task 5: Explore OCI Database with PostgreSQL Metrics in Grafana
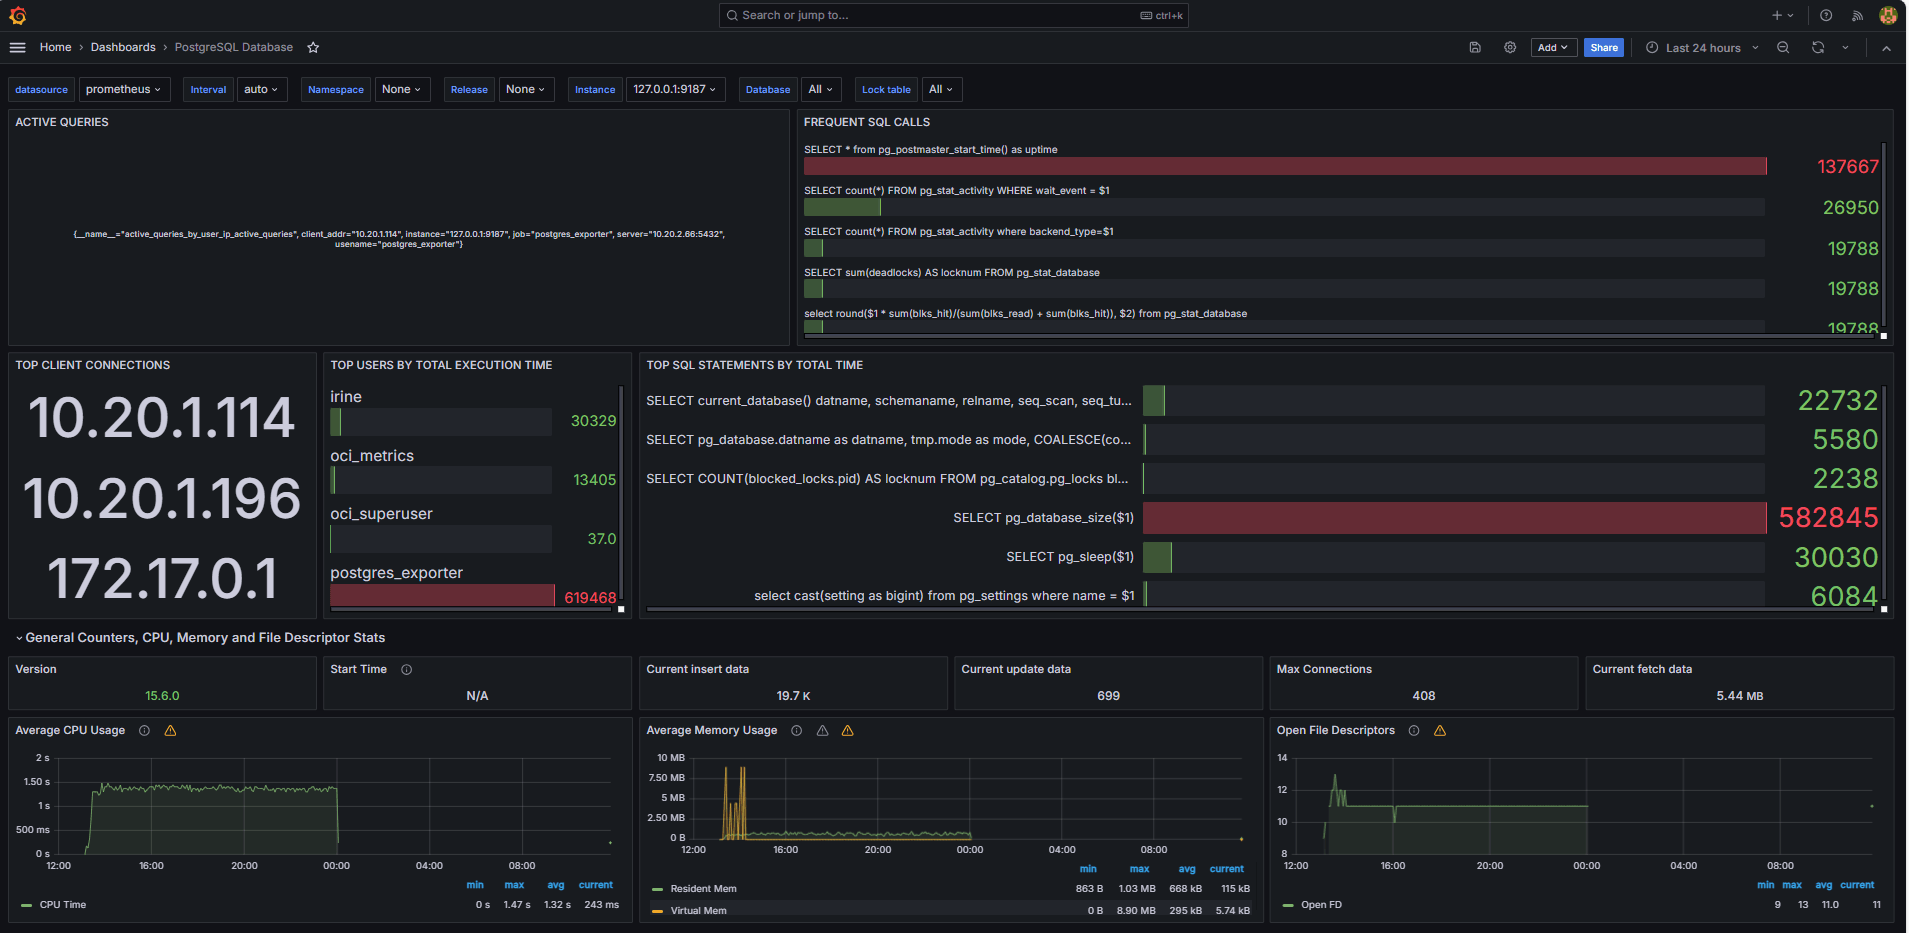
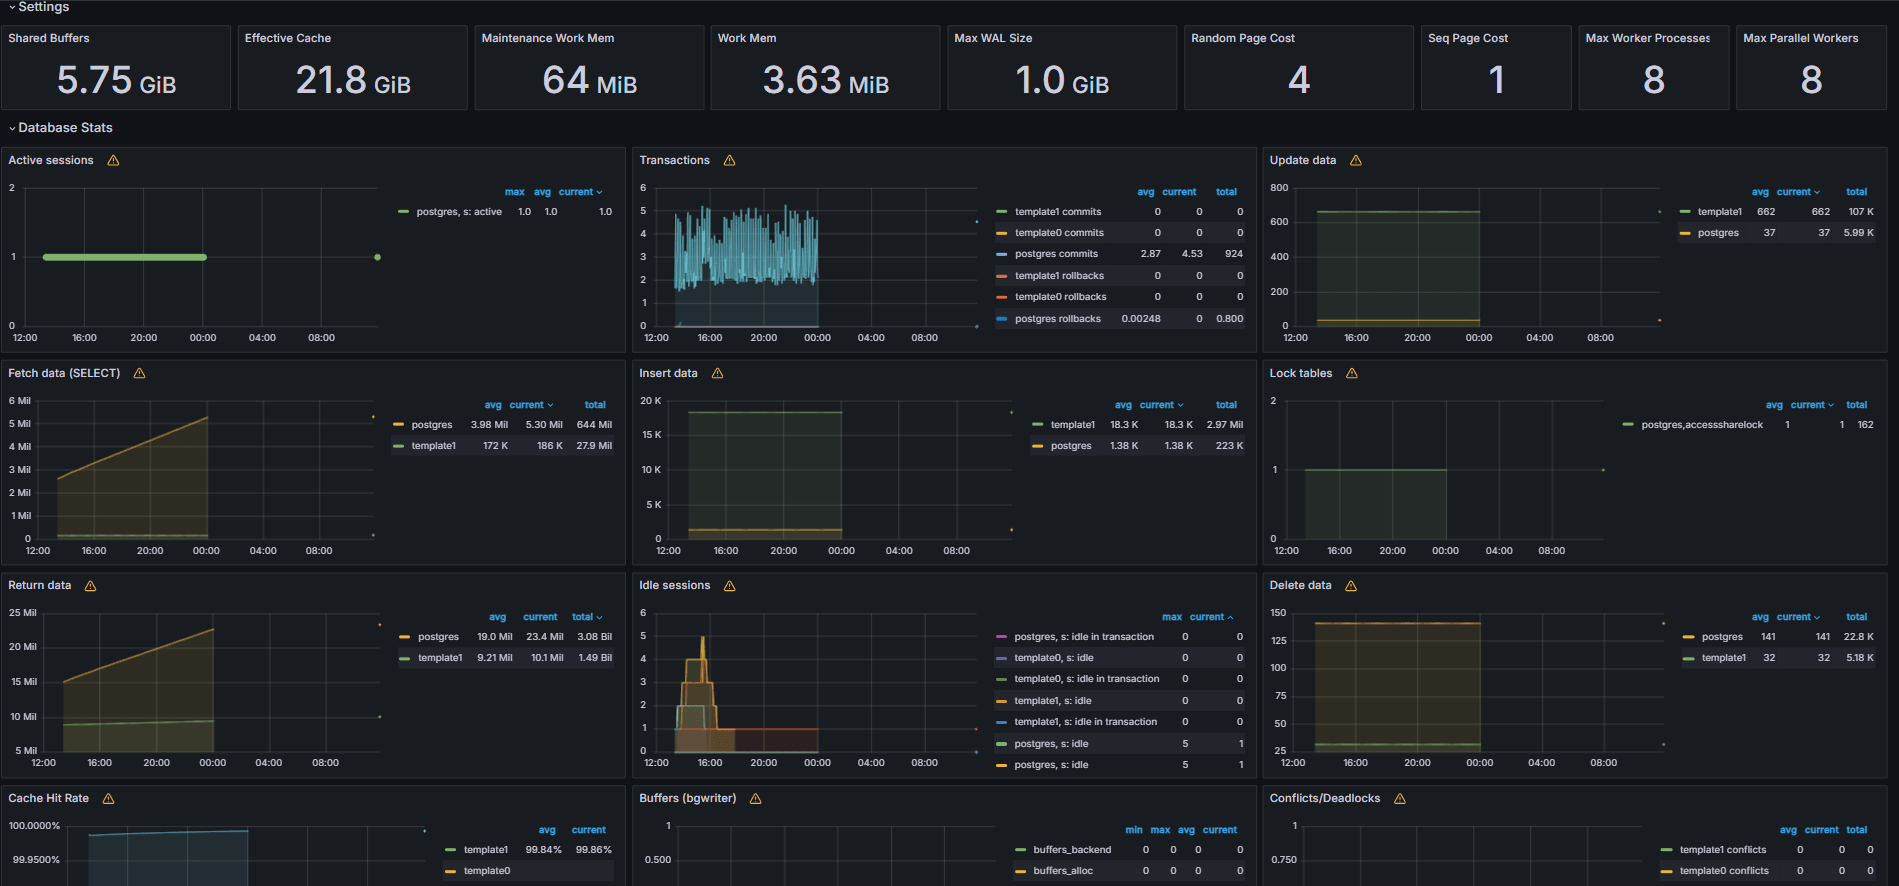
The following images show the final dashboards.
-
View metrics exposed from your custom
queries.yamlfile from the Explore tab in Grafana. -
Add visualizations for:
- Top slowest SQL statements.
- Top users.
- Active queries.
- Top client IPs.
- Query frequency (most called queries).
Task 6: Set Up Alert for OCI Database with PostgreSQL Bloat Metrics in Grafana
-
Collect Bloat Metric.
-
A custom SQL query was used to estimate table bloat, based on PostgreSQL system catalog views such as
pg_class,pg_namespace,pg_attribute, andpg_stats. -
This query was exposed as a custom metric through a PostgreSQL Exporter by adding it to the
queries.yamlfile, as shown in Task 2.2, and was subsequently scraped by Prometheus.
-
-
Configure Alert Rule.
-
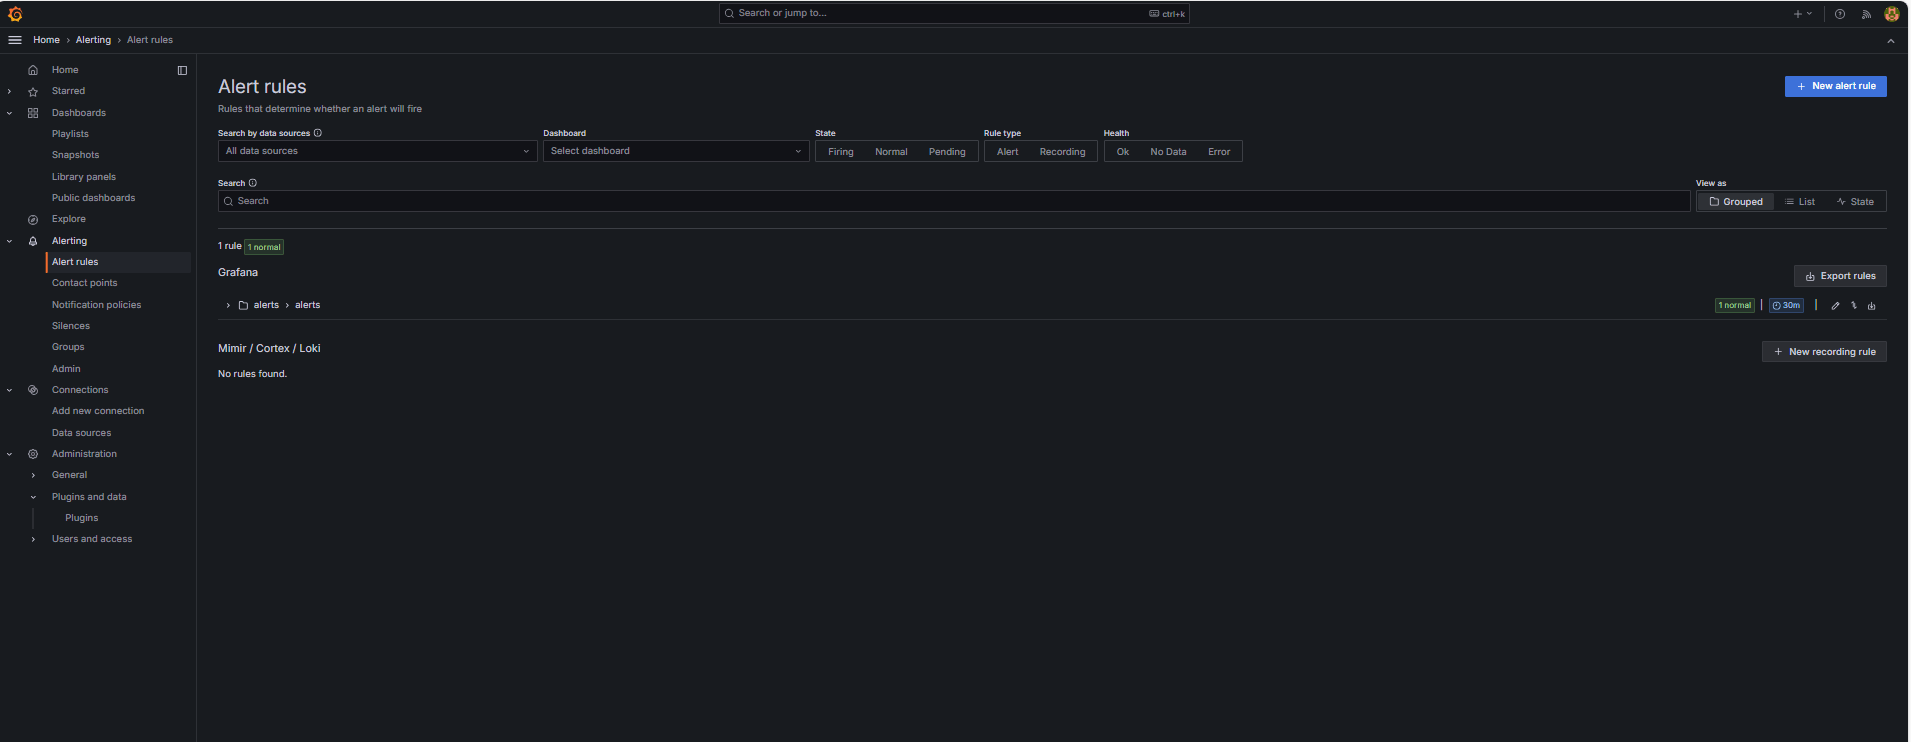
Navigate to Alerting and click Alert rules in Grafana.
-
Click + New alert rule.
-
Enter a Name for your alert rule.
-
Select Prometheus as the Data source.
-
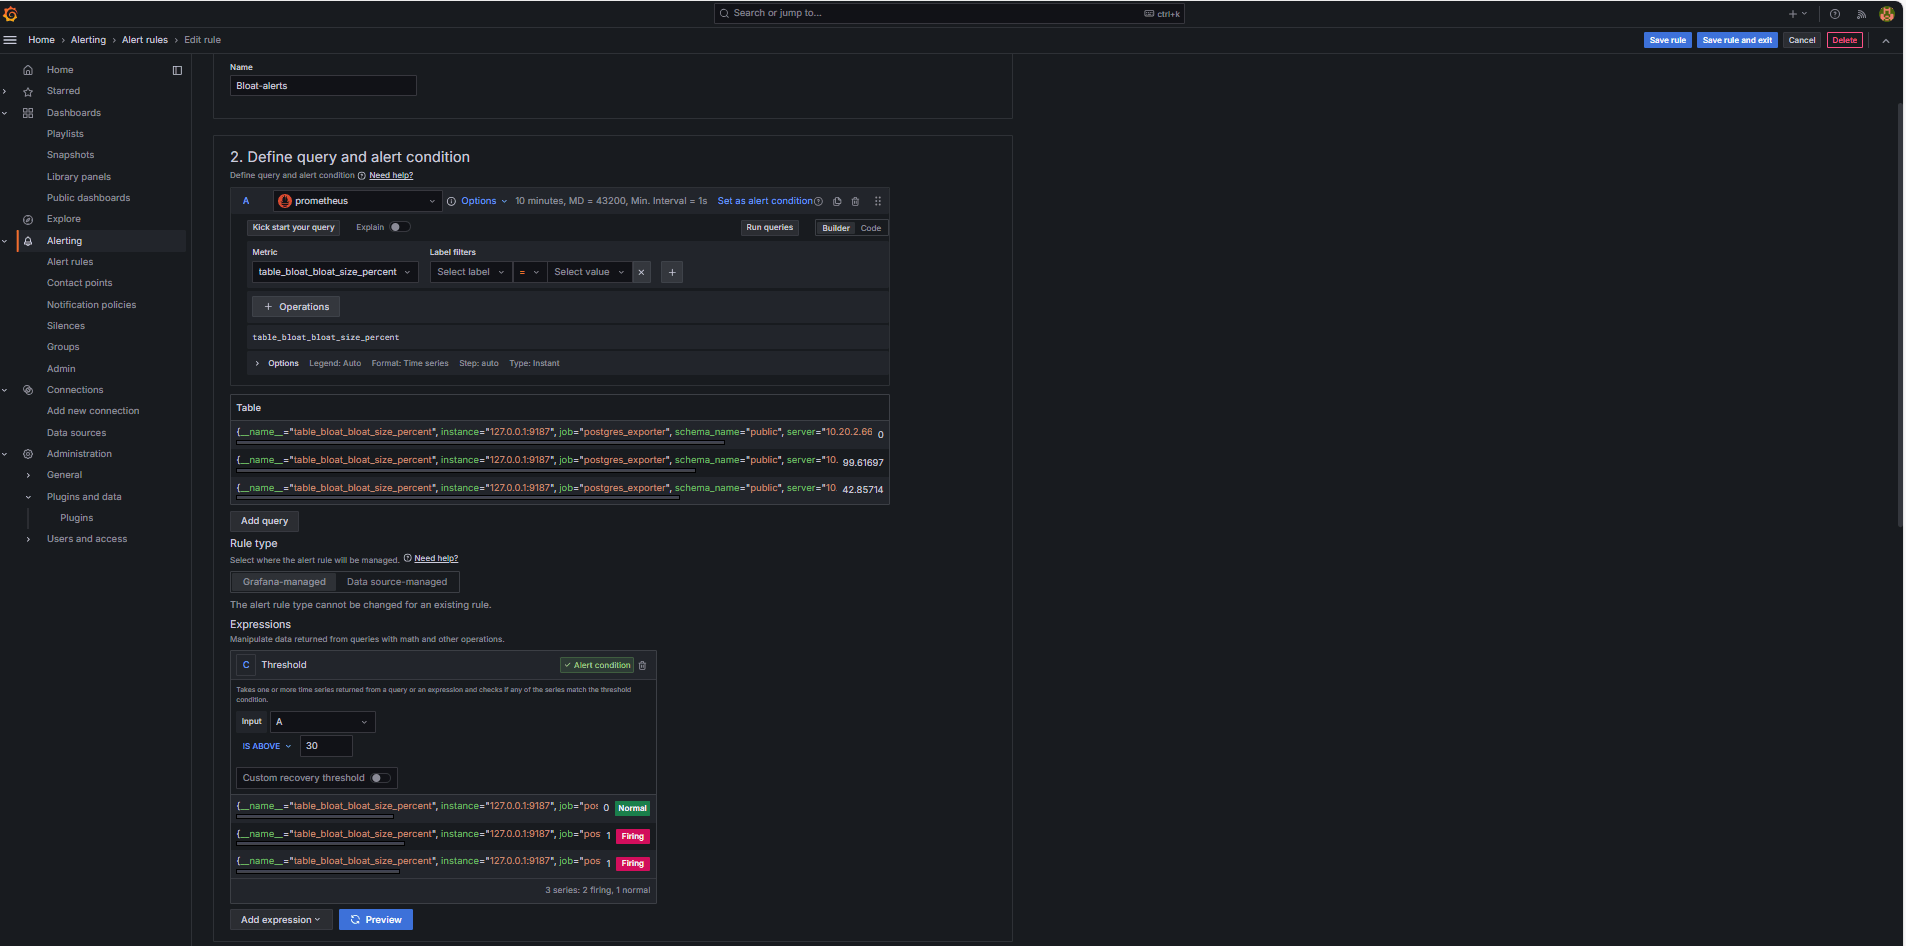
In the Define query and alert condition section, enter the following information.
-
Search for the
table_bloat_bloat_size_percentmetric. -
In the Alert condition builder, enter the following information.
-
Set Input: Select A.
-
Condition: Select IS ABOVE 30.
Note: You can click Preview to validate whether the alert would fire under current conditions.
-
-
-
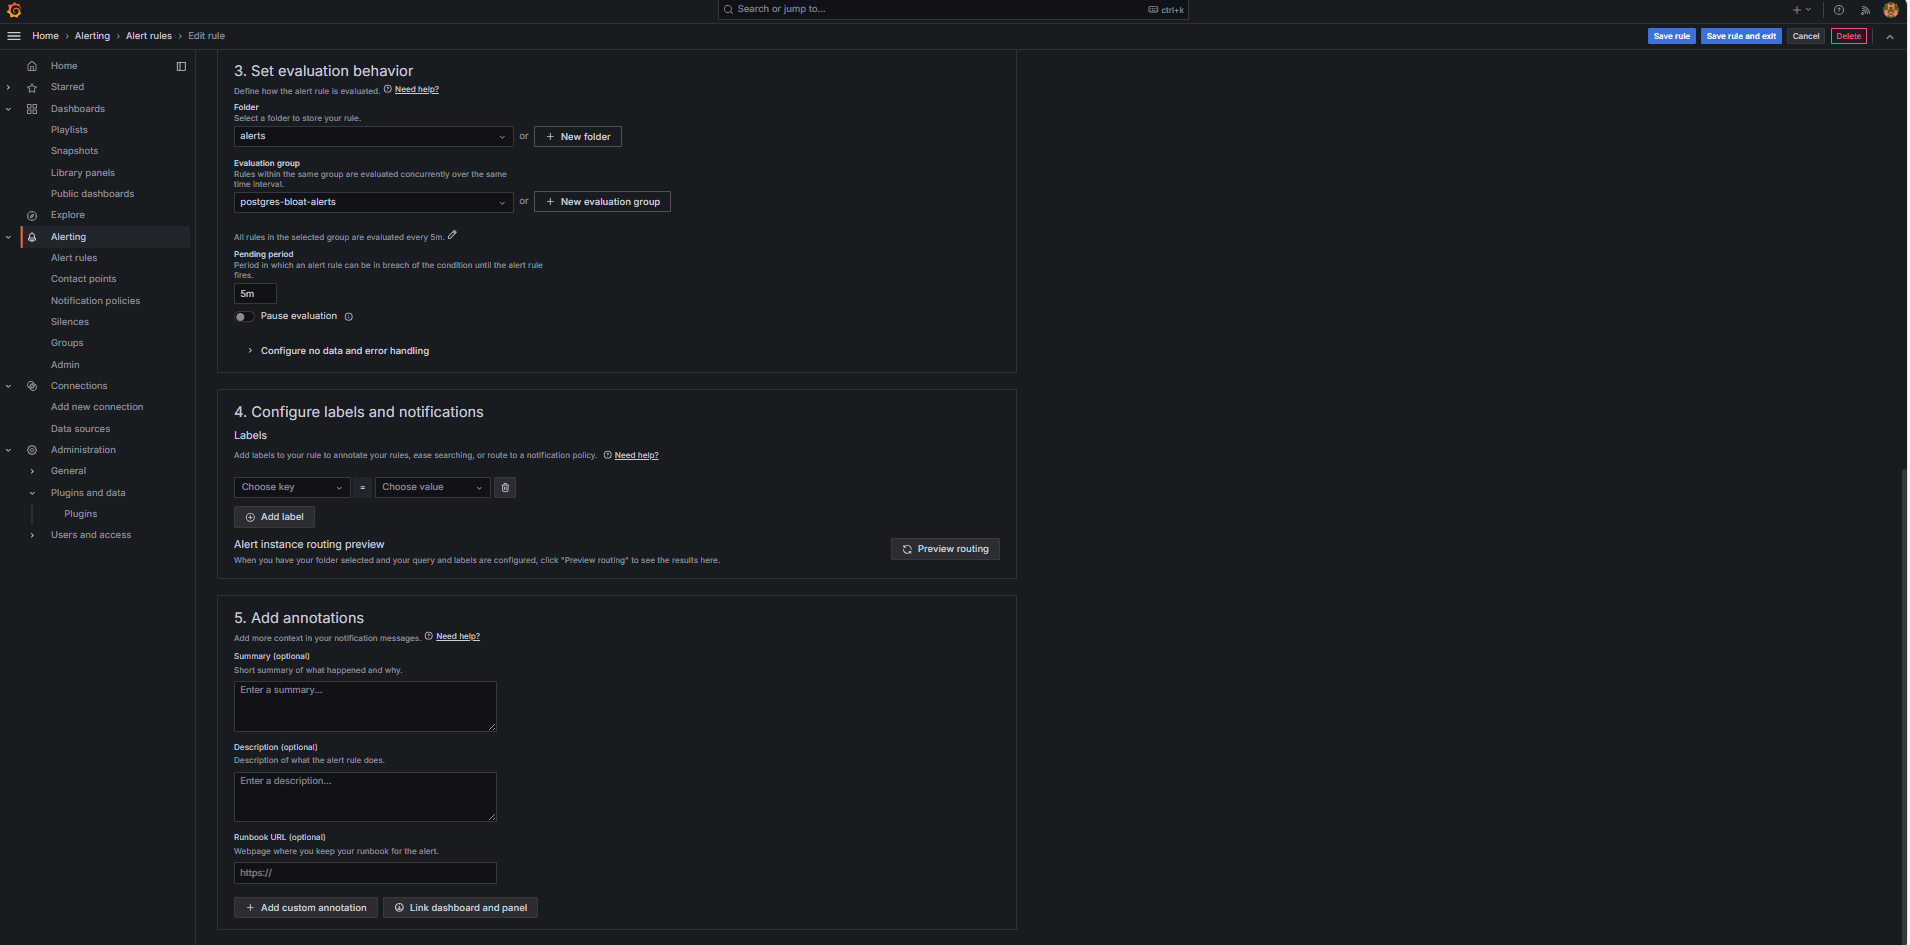
In the Set evaluation behavior section, enter the following information.
-
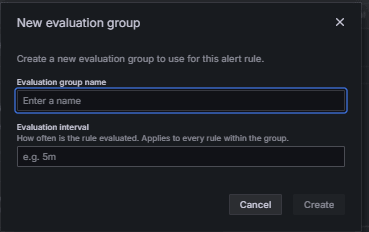
Click + New evaluation group.
-
Evaluation Group: Enter
postgres-bloat-alerts. -
Evaluation interval: Select
5m(this defines how often Grafana evaluates the alert rule). -
Pending period: Set to
5m(the alert must stay true for 5 continuous minutes before it triggers. This should be equal to or longer than the evaluation interval).
-
-
Click Save rule and exit to activate your alert.
-
-
Configure Email Alerting through SMTP (Gmail).
To enable email notifications for alerts in Grafana, configure the
smtpsection of yourgrafana.inifile.-
Edit the Grafana config file in the OCI Compute instance where you have installed Grafana.
sudo nano /etc/grafana/grafana.ini -
Uncomment and update the
smtpsection with the following content.[smtp] enabled = true host = smtp.gmail.com:587 user = your_email@gmail.com password = *************** skip_verify = true from_address = your_email@gmail.com from_name = Grafana ehlo_identity = localhost startTLS_policy = OpportunisticStartTLS enable_tracing = falseNote: To use Gmail, you must enable 2-Step Verification and generate an App Password from your Google account settings. Do not use your regular Gmail password.
-
After saving the config, restart Grafana to apply the changes using the following command.
sudo systemctl restart grafana-server
-
-
Set Up Contact Points for Alert Notifications.
Contact points define where and how Grafana sends alerts when a rule is triggered such as email, Slack, webhook, and so on.
-
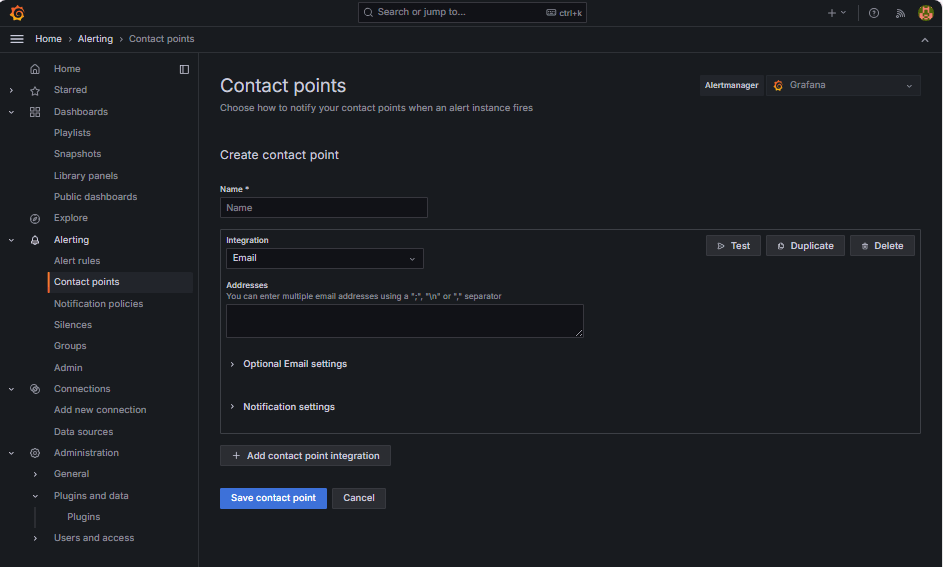
Navigate to Alerting and click Contact points in Grafana.
-
Click + New contact point to create one, or select and edit an existing one.
-
To configure an Email Contact Point, enter the following information.
-
Name: Enter the contact point name (for example,
grafana-default-email). -
Integration: Select Email.
-
Addresses: Enter one or more email addresses.
-
-
Click Test to verify email delivery.
-
Click Save contact point.
-
-
Configure Notification Policy.
Notification policies in Grafana control how and when alerts are routed to contact points. After setting up a contact point, you must create a notification policy to connect alerts to that contact point.
-
Navigate to Alerting and click Notification policies in Grafana.
-
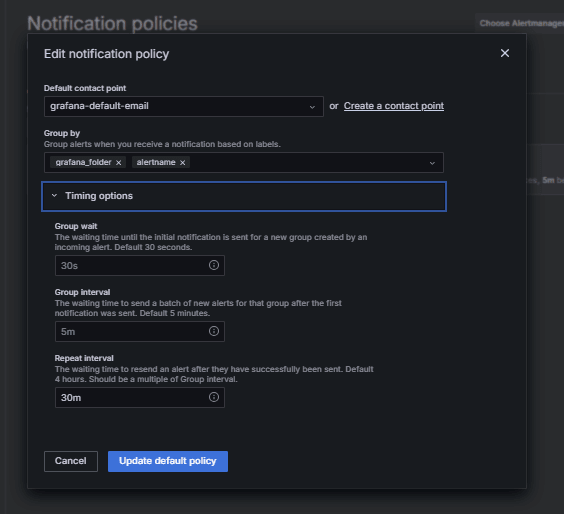
Click Edit on the default policy or + New policy.
-
Under Default contact point, select your contact (
grafana-default-email). -
Under Group by, you can group alerts based on label values such as:
-
grafana_folder -
alertname
-
-
Click Timing options and enter the following information.
-
Group wait: Select 30s, this is the time to wait before sending the first alert in a group.
-
Group interval: Select 5m, this is the time between batches of grouped alerts.
-
Repeat interval: Select 30m, this is the time after which the same alert is resent if still firing.
-
-
Click Update default policy to save.
-
-
Trigger and Verify Alert.
-
Simulate a threshold breach (optional).
To test alert triggering, you can either:
-
Temporarily lower the alert threshold (for example, set
bloat_size_percent > 0).Or,
-
Introduce bloat by performing repeated UPDATE or DELETE operations on a large test table.
-
-
Wait for evaluation.
Grafana checks alert conditions at your defined evaluation interval (for example, every 5 minutes). If the condition is true for the pending period (for example, 5 minutes), the alert will fire.
-
Email Delivery Check.
When triggered, the alert will be sent through the configured SMTP contact point (for example, Gmail). Check the inbox of the recipient address for a notification email from Grafana.

-
Grafana UI Feedback.
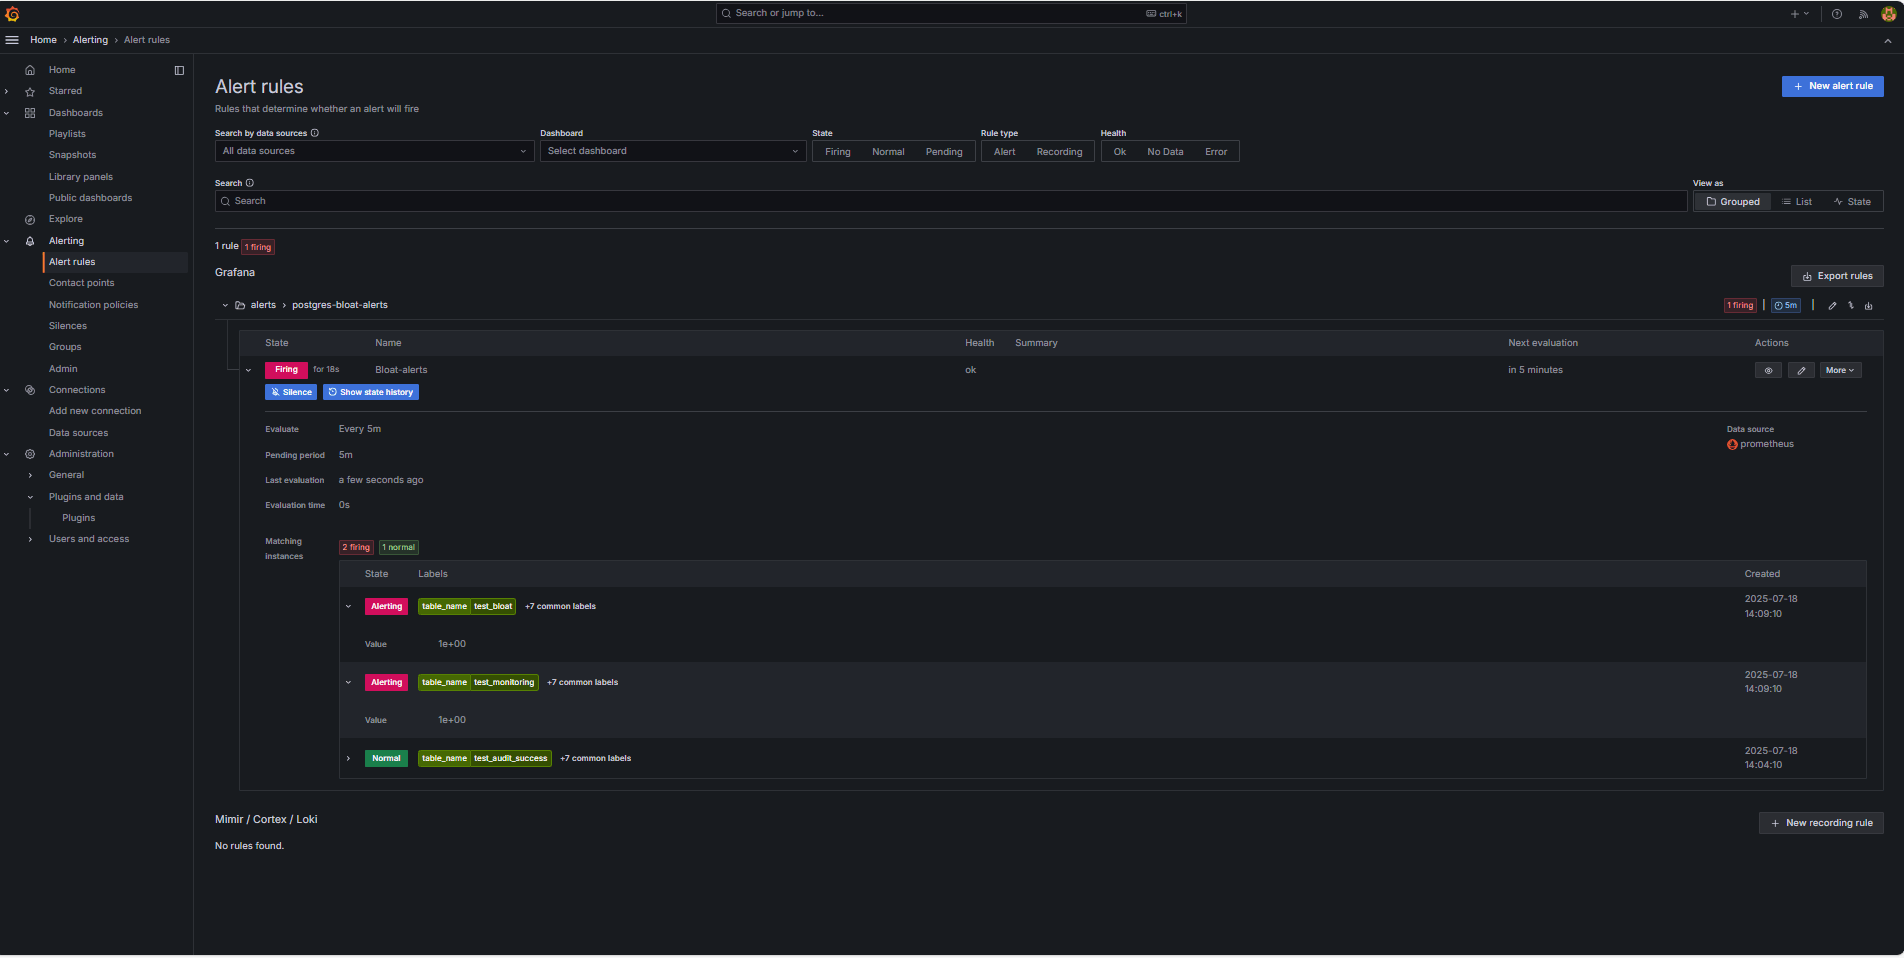
Navigate to Alerting and click Alert rules to view the alert status. You will see status indicators like Firing in the Alert rules page.
-
Related Links
Acknowledgments
- Author - Irine Benoy (Open-source Data Black Belt)
More Learning Resources
Explore other labs on docs.oracle.com/learn or access more free learning content on the Oracle Learning YouTube channel. Additionally, visit education.oracle.com/learning-explorer to become an Oracle Learning Explorer.
For product documentation, visit Oracle Help Center.
Monitor an OCI Database with PostgreSQL using Prometheus and Grafana
G39860-01
Copyright ©2025, Oracle and/or its affiliates.