Define a Sort Order for a Visualization
Define a sort order to apply multiple sorts to a visualization.
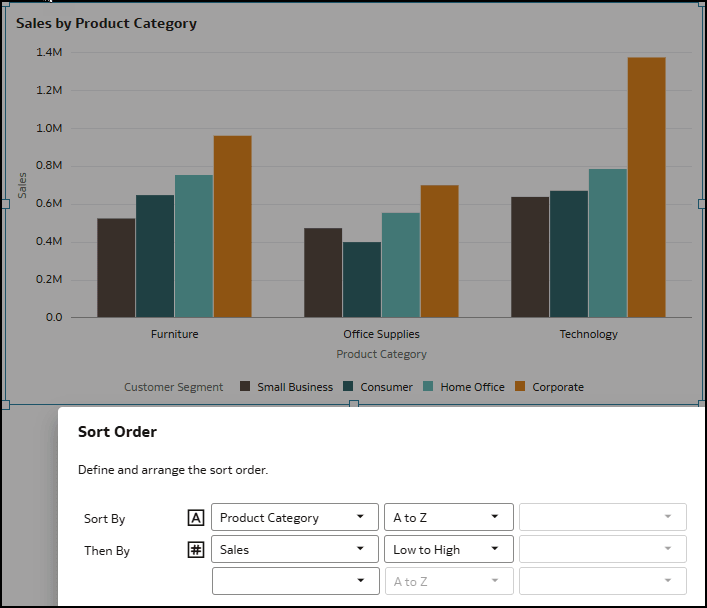
For example, you might want to sort a bar chart showing Sales by Product Category and Customer Segment. You can create a sort order to sort it first by Product Category alphabetically, and then by Sales from lowest to highest.
Description of the illustration sort_order_example.png
- On your home page, hover over a workbook, click Actions, then select Open.
- Hover over a visualization and click Sort
 in the visualization toolbar.
 - In the Sort Order dialog, in the Sort By row, click the Create new sort drop-down and select an attribute or a measure.
- Click the A to Z drop-down and select a sort method.
- In the second row, add another sort to apply next.
- Click OK.
