- User’s Guide for Oracle Analytics Desktop
- Connect to Your Data Using Datasets
- Enhance Your Data Using Quality Tiles
Enhance Your Data Using Quality Tiles
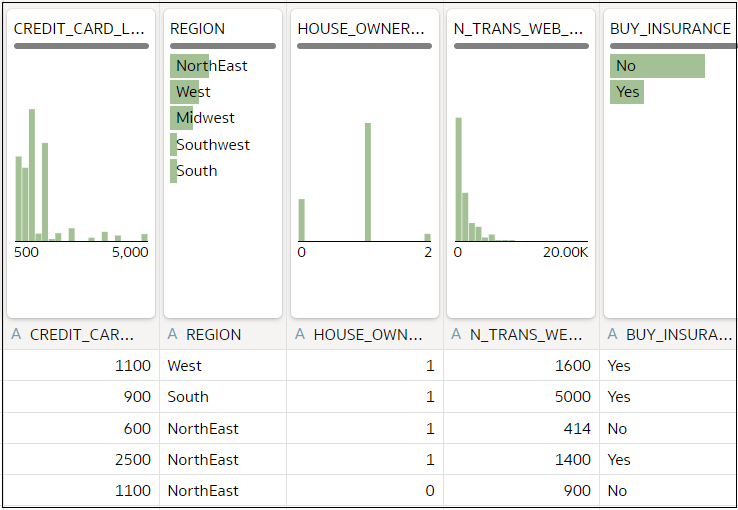
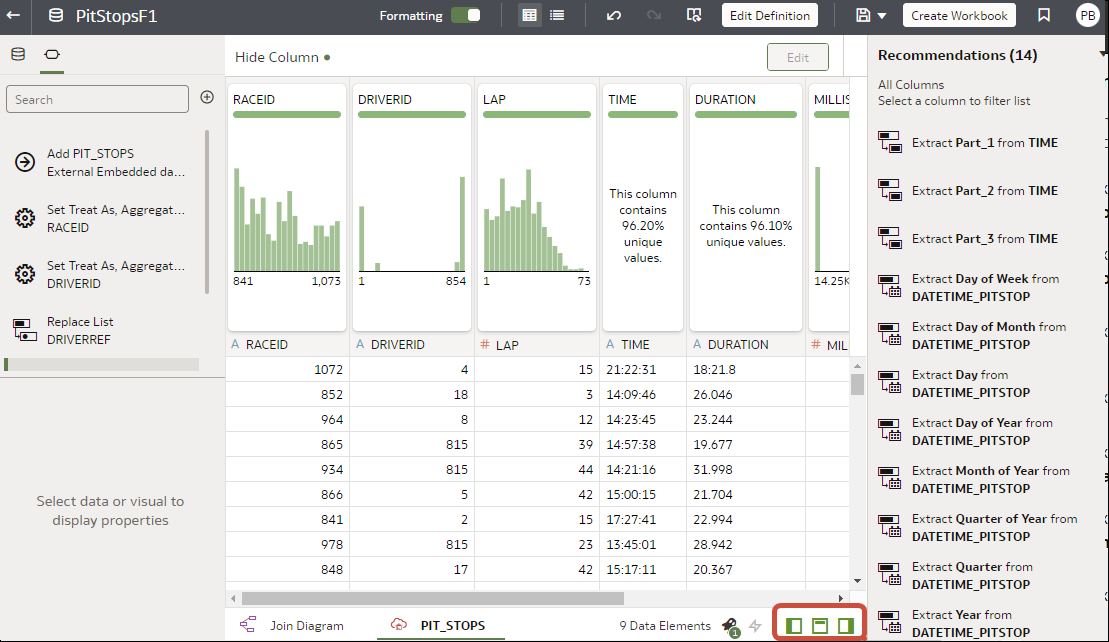
When you edit a dataset in the transform editor, Oracle Analytics displays a quality tile for each data column, which displays a visual summary of data quality and enables you to analyze data quality and enhance your data.
- On the Home page,
open a dataset or
workbook.
- Hover over the dataset, click Actions, and then select Open. In the Data Diagram or Join Diagram, right-click a data source and click Open to display the transform editor.
- Hover over the workbook that contains the dataset, click Actions, then select Open, then click Data. In the Data Diagram or Join Diagram, right-click a data source and click Open to display the transform editor.
- Use the quality insights to get an instant assessment of the quality of content
in that column based on a deep semantic understanding of the data.
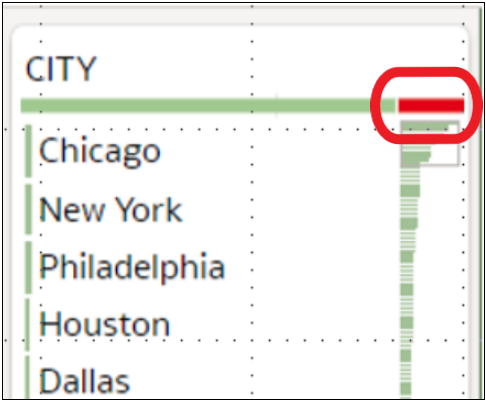
For example, hover over a quality bar to see how many valid and invalid values are in the column. Click on areas marked in red to filter on invalid values.
- To explore your data by applying a temporary filter, click one or more values
to use as a filter.Oracle Analytics highlights filter values with a green box. To unfilter a value, click the value again.When you filter on values, Oracle Analytics updates all data columns to instantly display only the rows relating to the filter values you selected. If you filter a value nearer the bottom of a long list, you might have to scroll down the list to locate it so that you can deselect the value.Note: Temporary filters that you apply in quality tiles aren't saved with your data (that is, aren't added to the data preparation script).
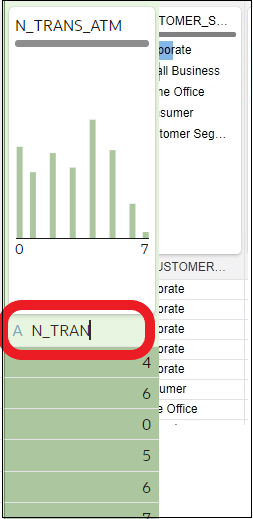
- To rename a column, click the column name to edit the value.
- To edit values.
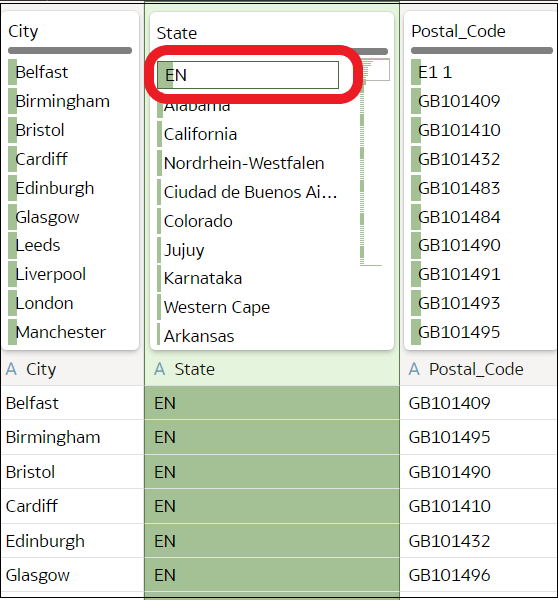
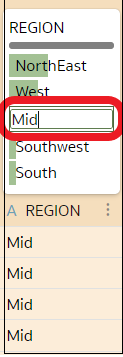
- In the quality tile, double-click the value you want to change.
- Oracle Analytics inserts the value that you specify into every row that contained the original value.
- To fix null or missing values:
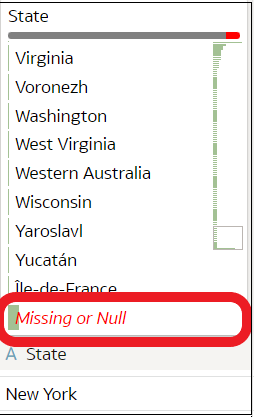
- In the quality tile, scroll to the last value in the list.If your data has missing values, you see Missing or Null highlighted in red.
Description of the illustration quality-insights-cleanse-1.png - Double-click Missing or Null, then enter the
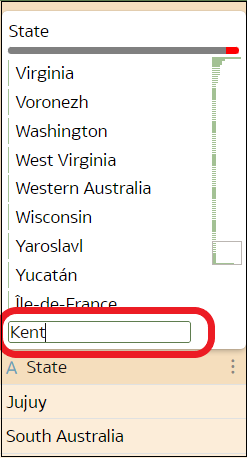
value you want to use.Oracle Analytics inserts the value that you specify into every Missing or Null row.
Description of the illustration quality-insights-cleanse-2.png
Changes that you apply in the quality insight tiles are added to the data preparation script (except for filters). - In the quality tile, scroll to the last value in the list.