Before You Start with Statistical Analytics
To add statistical analytics to your workbooks such as forecasts, outliers, and trend lines, you can either use ready-to-use analytics on the Analytics pane of the Data Panel, or use functions in expression builder if you need more control over the configuration.
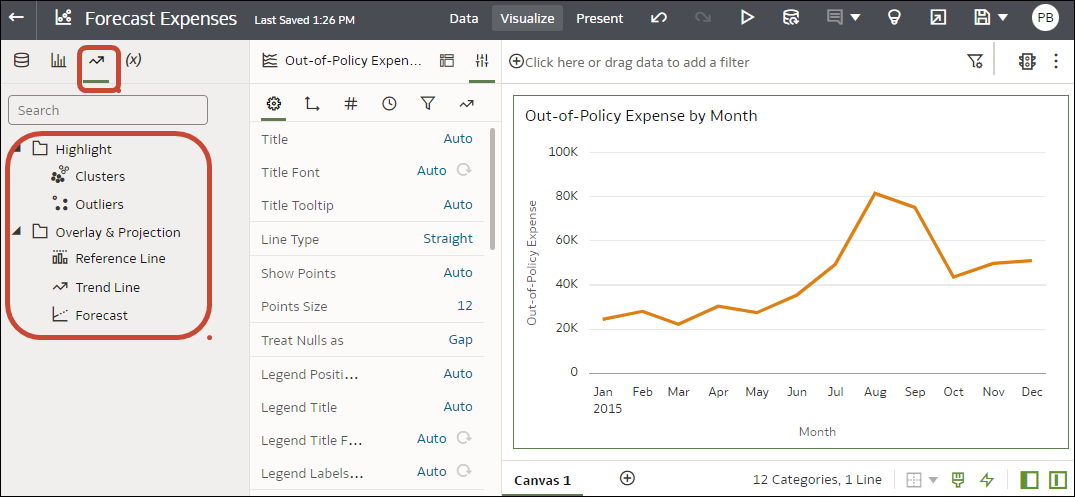
Oracle Analytics enables you to add a range of statistical analytics from the Analytics pane of the Data Panel, which come fully configured so that you don't need to be a statistical expert to achieve results. 
Description of the illustration stat_analytics-png.png
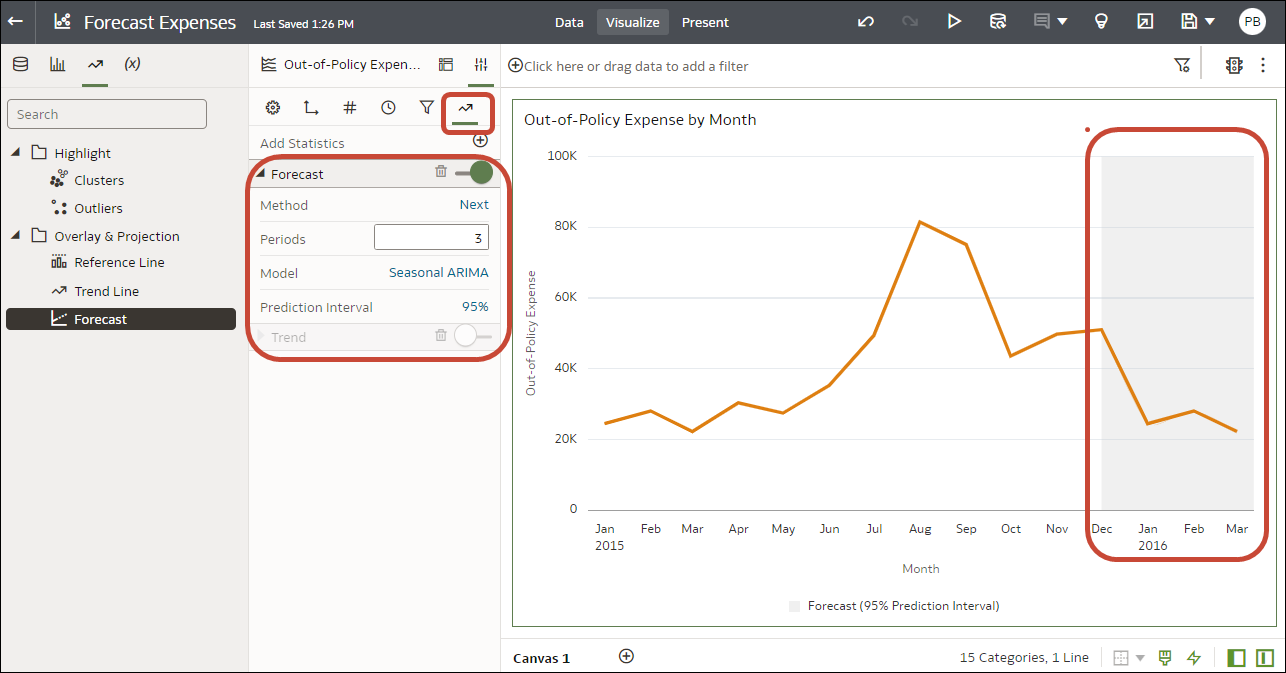
You configure the options for the analytics to match your requirements. For example, if your visualization analyzes Out-of-Policy Expenses by Month, you might use the Periods option to specify the number of months to forecast. In this example, '3' forecasts three months January, February, and March from the final data point for December.
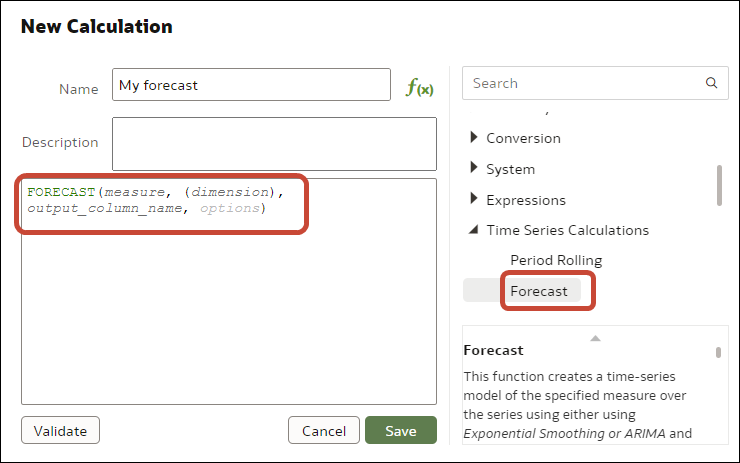
If you need more control over statistical settings, or you want to use the analytic in other visualizations, consider adding a calculation and use the expression builder to define the equivalent function. From the Data pane, click Add (+), then Create Calculation to display the expression builder. For example, you might use the FORECAST() function.
See Create a Calcuated Data Element.

Description of the illustration stat-analytics4-png.png
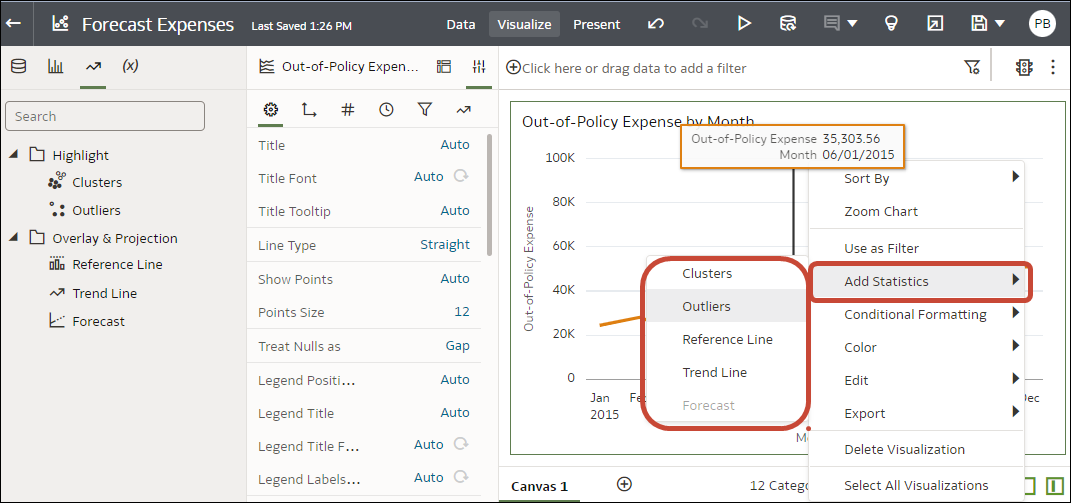
Tip:You can also access the statistical analytics options by right-clicking on a visualization, and selecting Add Statistics.
Description of the illustration stat-analytics2-png.png
