Add Drawings, Shapes, and Clip Art
Publisher supports Microsoft Word drawing, shape, and clip art features. You can add these objects to the template and they're rendered in the final PDF output or HTML output (not supported for other output types).
The following AutoShape categories are supported:
-
Lines - Straight, arrows, connectors, curve, free form, and scribble.
-
Connectors - Straight connectors only are supported. Curved connectors can be achieved by using a curved line and specifying the end styles to the line.
-
Basic Shapes - All shapes are supported. You can’t include images inside the shape objects.
-
Block arrows - All arrows are supported.
-
Flowchart - All flowchart objects are supported.
-
Stars and Banners - All objects are supported.
-
Callouts - The "line" callouts are not supported.
-
Clip Art - Add images to the templates using the Microsoft Clip Art libraries.
Add Freehand Drawings
The freehand drawing tool helps you create drawings to the final PDF.
Use the freehand drawing tool in Microsoft Word to create drawings in the template to be rendered in the final PDF output.
Layer Shapes
You can layer shapes on top of each other and use the transparency setting in Microsoft Word to allows shapes on lower layers to show through.
The following illustration shows an example of layered shapes.
Add Microsoft Equations
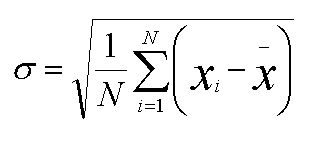
Use the equation editor to generate equations in the output.
The following figure shows an example of an equation:
Add Organization Charts
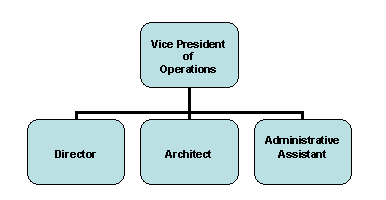
Use the organization chart functionality of Microsoft Word in the templates and the chart that is rendered in the output.
The following figure shows an example of an organization chart.
Add WordArt
You can use Microsoft Word's WordArt functionality in the templates.
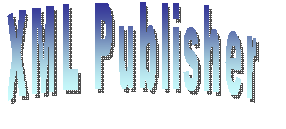
Some Microsoft WordArt uses a bitmap operation that currently can't be converted to SVG. To use the unsupported WordArt in the template, you can take a screenshot of the WordArt then save it as an image (gif, jpeg, or png) and replace the WordArt with the image.
The following figure shows a sample WordArt example.
Add Data-Driven Shapes
In addition to supporting the static shapes and features in the templates, Publisher supports the manipulation of shapes based on incoming data or parameters, as well.
The following manipulations are supported:
-
Replicate
-
Move
-
Change size
-
Add text
-
Skew
-
Rotate
These manipulations not only apply to single shapes, but you can use the group feature in Microsoft Word to combine shapes together and manipulate them as a group.
Include Manipulation Commands
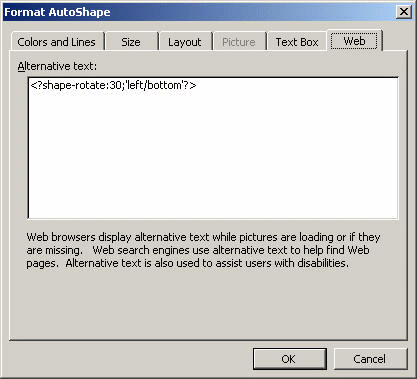
Enter manipulation commands for a shape in the Web tab of the shape's properties dialog as shown in this figure.
Replicate Shapes
You can replicate a shape based on incoming XML data in the same way you replicate data elements in a for-each loop.
To replicate a shape, use a for-each@shape command in conjunction with a shape-offset declaration. For example, to replicate a shape down the page, use the following syntax:
<?for-each@shape:SHAPE_GROUP?>
 <?shape-offset-y:(position()-1)*100?>
<?end for-each?>
where
for-each@shape opens the for-each loop for the shape context
SHAPE_GROUP is the name of the repeating element from the XML file. For each occurrence of the element SHAPE_GROUP a new shape is created.
shape-offset-y: is the command to offset the shape along the y-axis.
(position()-1)*100) sets the offset in pixels per occurrence. The XSL position command returns the record counter in the group (that is 1,2,3,4); one is subtracted from that number and the result is multiplied by 100. Therefore for the first occurrence the offset would be 0: (1-1) * 100. The offset for the second occurrence would be 100 pixels: (2-1) *100. And for each subsequent occurrence the offset would be another 100 pixels down the page.
Add Text to Shapes
You can add text to a shape dynamically either from the incoming XML data or from a parameter value.
In the Property dialog enter the following syntax:
<?shape-text:SHAPETEXT?>
where SHAPETEXT is the element name in the XML data. At runtime the text is inserted into the shape.
Add Text Along a Path
You can add text along a line or curve from incoming XML data or a parameter.
After drawing the line, in the Property dialog enter:
<?shape-text-along-path:SHAPETEXT?>
where SHAPETEXT is the element from the XML data. At runtime the value of the element SHAPETEXT is inserted above and along the line.
Move a Shape
You can move a shape or transpose it along both the x and y-axes based on the XML data.
For example to move a shape 200 pixels along the y-axis and 300 along the x-axis, enter the following commands in the property dialog of the shape:
<?shape-offset-x:300?>
<?shape-offset-y:200?>
Rotate a Shape
You can rotate a shape about a specified axis based on the incoming data.
Use the following command:
<?shape-rotate:ANGLE;'POSITION'?>
where
ANGLE is the number of degrees to rotate the shape. If the angle is positive, the rotation is clockwise; if negative, the rotation is counterclockwise.
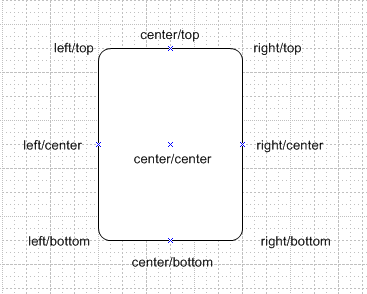
POSITION is the point about which to carry out the rotation, for example, 'left/top'. Valid values are combinations of left, right, or center with center, top, or bottom. The default is left/top. The following illustration shows these valid values.
To rotate this rectangle shape about the bottom right corner, enter the following syntax:
<?shape-rotate:60,'right/bottom'?>
You can also specify an x,y coordinate within the shape itself about which to rotate.
Skew a Shape
You can skew a shape using the skew command.
You can skew a shape along its x or y axis using the following commands:
<?shape-skew-x:ANGLE;'POSITION'?>
<?shape-skew-y:ANGLE;'POSITION'?>
where
ANGLE is the number of degrees to skew the shape. If the angle is positive, the skew is to the right.
POSITION is the point about which to carry out the rotation, for example, 'left/top'. Valid values are combinations of left, right, or center with center, top, or bottom. See Rotate a Shape. The default is 'left/top'.
For example, to skew a shape by 30 degrees about the bottom right hand corner, enter the following:
<?shape-skew-x:number(.)*30;'right/bottom'?>
Change the Size of Shapes
You can change the size of a shape using the appropriate commands either along a single axis or both axes.
To change a shape's size along both axes, use:
<?shape-size:RATIO?>
where RATIO is the numeric ratio to increase or decrease the size of the shape. Therefore a value of 2 would generate a shape twice the height and width of the original. A value of 0.5 would generate a shape half the size of the original.
To change a shape's size along the x or y axis, use:
<?shape-size-x:RATIO?>
<?shape-size-y:RATIO?>
Changing only the x or y value has the effect of stretching or shrinking the shape along an axis. This can be data driven.
Combine Commands
You can also combine these commands to carry out multiple transformations on a shape at one time. For example, you can replicate a shape and for each replication, rotate it by some angle and change the size at the same time.
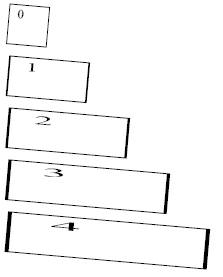
The following example shows how to replicate a shape, move it 50 pixels down the page, rotate it by five degrees about the center, stretch it along the x-axis and add the number of the shape as text:
<for-each@shape:SHAPE_GROUP?>
 <?shape-text:position()?>
 <?shape-offset-y:position()*50?>
 <?shape-rotate:5;'center/center'?>
 <?shape-size-x:position()+1?>
<end for-each?>
These commands generate the output shown in the following shape transformation figure:
CD Ratings Example
This example demonstrates how to set up a template that generates a star-rating based on data from an incoming XML file.
Assume the following incoming XML data:
<CATALOG>
 <CD>
  <TITLE>Empire Burlesque</TITLE>
  <ARTIST>Bob Dylan</ARTIST>
  <COUNTRY>USA</COUNTRY>
  <COMPANY>Columbia</COMPANY>
  <PRICE>10.90</PRICE>
  <YEAR>1985</YEAR>
  <USER_RATING>4</USER_RATING>
 </CD>
 <CD>
  <TITLE>Hide Your Heart</TITLE>
  <ARTIST>Bonnie Tylor</ARTIST>
  <COUNTRY>UK</COUNTRY>
  <COMPANY>CBS Records</COMPANY>
  <PRICE>9.90</PRICE>
  <YEAR>1988</YEAR>
  <USER_RATING>3</USER_RATING>
 </CD>
 <CD>
  <TITLE>Still got the blues</TITLE>
  <ARTIST>Gary More</ARTIST>
  <COUNTRY>UK</COUNTRY>
  <COMPANY>Virgin Records</COMPANY>
  <PRICE>10.20</PRICE>
  <YEAR>1990</YEAR>
  <USER_RATING>5</USER_RATING>
 </CD>
 <CD>
  <TITLE>This is US</TITLE>
  <ARTIST>Gary Lee</ARTIST>
  <COUNTRY>UK</COUNTRY>
  <COMPANY>Virgin Records</COMPANY>
  <PRICE>12.20</PRICE>
  <YEAR>1990</YEAR>
  <USER_RATING>2</USER_RATING>
 </CD>
<CATALOG>
Notice the USER_RATING element for each CD. Using
this data element and the shape manipulation commands, you can create a visual representation of
the ratings so that the reader can compare them at a glance. A template to achieve this is shown
in the following visual representation of ratings figure:
The values for the fields are shown in the following values for fields table:
| Field | Form Field Entry |
|---|---|
|
F |
|
|
TITLE |
|
|
ARTIST |
|
|
E |
|
|
(star shape) |
Web Tab Entry:
|
The form fields hold the simple element values. The only difference with this template is the value for the star shape. The replication command is placed in the Web tab of the Format AutoShape dialog.
In the for-each@shape command you can use a command to create a "for...next loop" construct. Specify 1 as the starting number; the value of USER_RATING as the final number; and 1 as the step value. As the template loops through the CDs, it creates an inner loop to repeat a star shape for every USER_RATING value (that is, a value of 4 generates 4 stars). The output from this template and the XML sample is shown in the following figure:
Grouped Shape Example
This example shows how to combine shapes into a group and have them react to the incoming data both individually and as a group.
Assume the following XML data:
<SALES>
 <SALE>
  <REGION>Americas</REGION>
  <SOFTWARE>1200</SOFTWARE>
  <HARDWARE>850</HARDWARE>
  <SERVICES>2000</SERVICES>
 </SALE>
 <SALE>
  <REGION>EMEA</REGION>
  <SOFTWARE>1000</SOFTWARE>
  <HARDWARE>800</HARDWARE>
  <SERVICES>1100</SERVICES>
 </SALE>
 <SALE>
  <REGION>APAC</REGION>
  <SOFTWARE>900</SOFTWARE>
  <HARDWARE>1200</HARDWARE>
  <SERVICES>1500</SERVICES>
 </SALE>
</SALES>
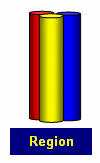
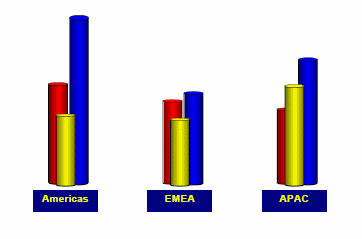
You can create a visual representation of this data so that users can very quickly understand the sales data across all regions. Do this by first creating the composite shape in Microsoft Word that you want to manipulate. The following figure shows a composite shape comprising four components:
The shape consists of three cylinders: red, yellow, and blue. These represent the data elements software, hardware, and services. The combined object also contains a rectangle that is enabled to receive text from the incoming data.
The following commands are entered into the Web tab:
Red cylinder: <?shape-size-y:SOFTWARE div 1000;'left/bottom'?>
Yellow cylinder: <?shape-size-y:HARDWARE div 1000;'left/bottom'?>
Blue cylinder: <?shape-size-y:SERVICES div 1000;'left/bottom'?>
The shape-size command is used to stretch or shrink the cylinder based on the values of the elements SOFTWARE, HARDWARE, and SERVICES. The value is divided by 1000 to set the stretch or shrink factor. For example, if the value is 2000, divide that by 1000 to get a factor of 2. The shape generates as twice its current height.
The text-enabled rectangle contains the following command in its Web tab:
<?shape-text:REGION?>
At runtime the value of the REGION element is displayed in the rectangle.
All of these shapes were then grouped together and in the Web tab for the grouped object, the following syntax is added:
<?for-each@shape:SALE?>
<?shape-offset-x:(position()-1)*110?>
<?end for-each?>
In this set of commands, the for-each@shape loops over the SALE group. The shape-offset command moves the next shape in the loop to the right by a specific number of pixels. The expression (position()-1) sets the position of the object. The position() function returns a record counter while in the loop, so for the first shape, the offset would be 1-1*110, or 0, which would place the first rendering of the object in the position defined in the template. Subsequent occurrences would be rendered at a 110 pixel offset along the x-axis (to the right).
At runtime three sets of shapes are rendered across the page, as shown in the following figure:
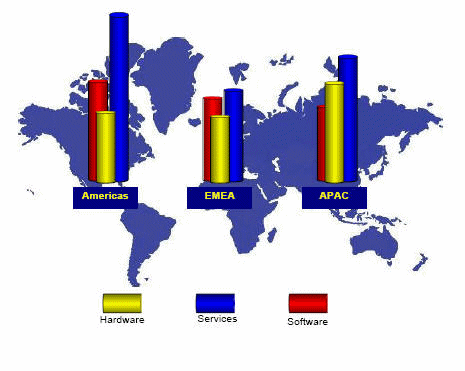
To make an even more visually representative report, these shapes can be superimposed onto a world map. Just use the Order dialog in Microsoft Word to layer the map behind the grouped shapes.
-
Microsoft Word 2000 Users: After you add the background map and overlay the shape group, use the Grouping dialog to make the entire composition one group.
-
Microsoft Word 2002/3 Users: These versions of Word have an option under Tools > Options, General tab to "Automatically generate drawing canvas when inserting autoshapes". Using this option removes the need to do the final grouping of the map and shapes. You can now generate a visually appealing output for the report as seen in the following figure:
