Page Layout Tab
The Page Layout tab contains commands to set up the layout.
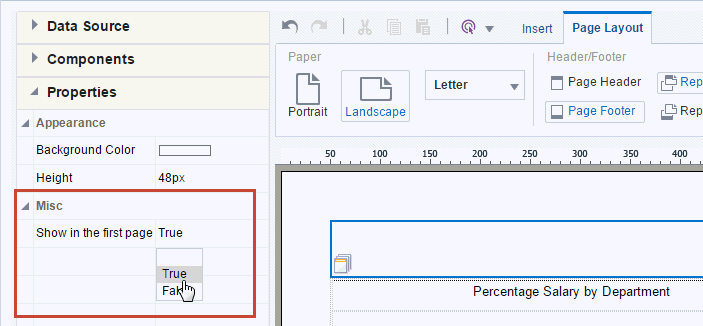
The figure below shows the Page Layout tab.
Paper Options
Paper options include Orientation and Paper Size.
| Option | Description |
|---|---|
|
Orientation |
Choose Portrait or Landscape. |
|
Paper Size |
Select from the following paper size options: Letter, Legal, A4, A3, Executive, B5, Com-10, Monarch DL, or C5. The paper size determines the dimensions of the layout area. |
Header/Footer Options
This table describes the header and footer options.
| Option | Description |
|---|---|
|
Page Header |
Click to insert a page header in the layout. By default, the page header appears on every page of a printed report, but can be configured to skip the first page. To remove the page header, click Page Header again. |
|
Page Footer |
Click to insert a page footer in the layout. By default, the page footer appears on every page of a printed report, but can be configured to skip the last page. To remove the page footer, click Page Footer again. |
|
Report Header |
Click to insert a report header to the layout. The report header appears only once at the beginning of the report. To remove the report header, click Report Header again. |
|
Report Footer |
Click to insert a report footer to the layout. The report footer appears only once at the end of the report. To remove the report footer, click Report Footer again. |
Set Properties for Headers and Footers
The Properties pane enables you to set the following properties for headers and footers.
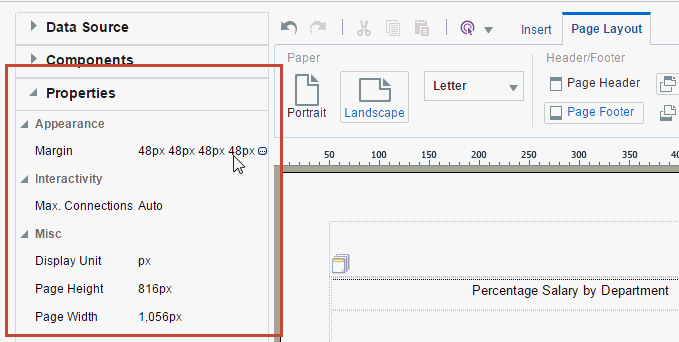
To access the Properties pane, select the header or footer in the design region, then click Properties from the accordion pane on the left of the page.
For all report and page headers and footers:
-
Height - Set the height of the header region in pixels, points, centimeters, or inches
For headers:
-
Show in the first page - Select True to show the header in the first page. Select False to suppress the header from the first page.
This figure shows the Properties for a report header.
For footers:
-
Show in the last page - Select True to show the footer in the last page. Select False to suppress the footer from the last page.
View Options
The following table describes view options.
| Option | Description |
|---|---|
|
Grid |
Click to insert gridlines in the layout design area. The grid unit size depends on the Display Unit selected. To remove the gridlines, click Grid again. |
|
Ruler |
Click to insert a display ruler across the top of the layout design area. The ruler units depend on the Display Unit. To remove the ruler, click Ruler again. |
Display Unit
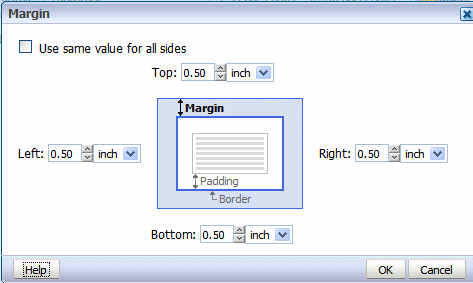
Select the unit of measure to display. This unit is used for the ruler and grid view options, as well as for any other function that displays a measurement, such as setting border widths and sizing grid cells. Options are: inch, px (pixel), cm (centimeter), and point (pt).
Configure Events
The Configure Events option enables you to configure how components of the layout respond to events triggered by a user when viewing the report in interactive mode.
The two types of events are:
-
Filter - If you click an element in a list, chart, or pivot table, that element is used to dynamically filter other components defined as targets in the report. The component being clicked doesn't change.
-
Show Selection Only - If you click an element of a list, chart, or pivot table, the chart or pivot table (being clicked) shows the results for the selected element only. This action doesn't affect other components of the report.
Example of Filter Event Configuration
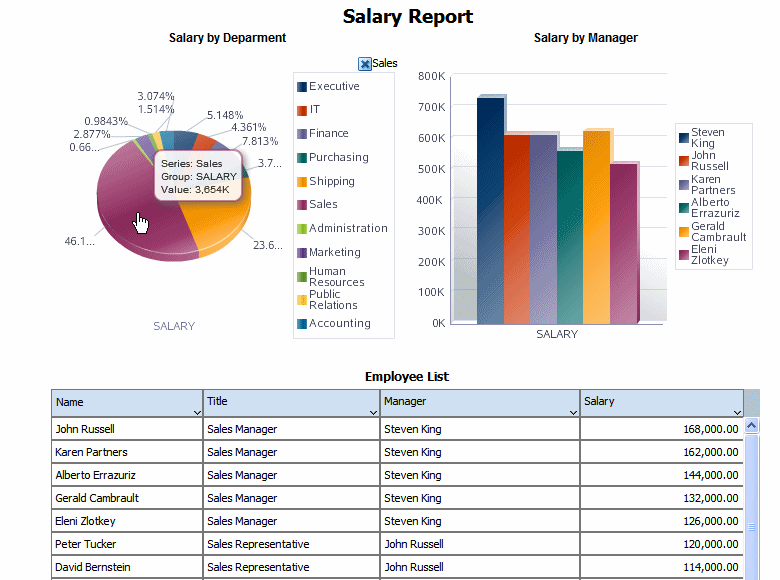
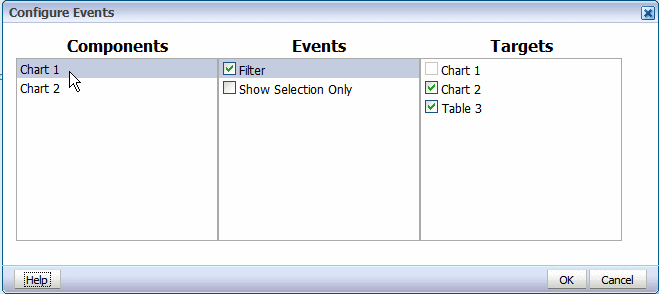
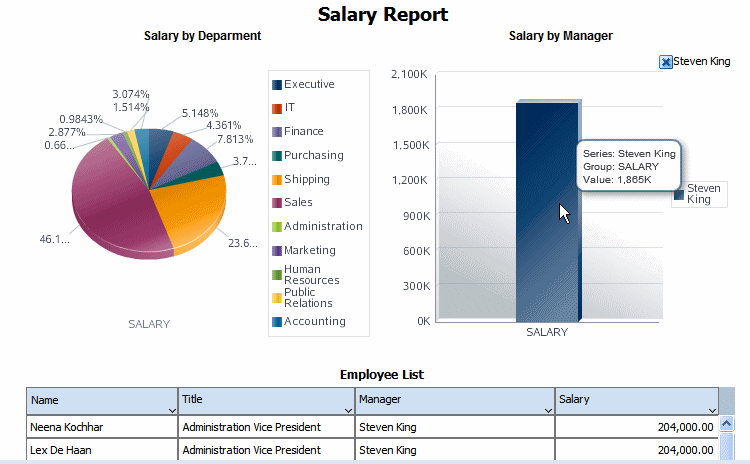
The illustration here shows an example of filter event configuration. The layout contains two charts and a table. The first chart shows salary totals by department in a pie chart. The second chart shows salary totals by manager in a bar chart. The table displays a list of employees and their salaries.
In this report, if a user clicks on a value in the Salary by Department chart, you want the Salary by Manager chart and the Employees table to automatically filter to show only the managers and employees in the selected department.
Example: Show Selection Only
The Show Selection Only event displays only the value of the selected element within the chart or pivot table (being acted on).
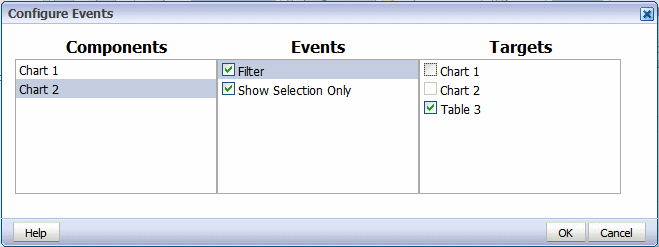
In the example shown in the following figure, Chart 2 is configured with Show Selection Only enabled and Filter enabled with Table 3 as the Target.
This configuration results in the output shown in the following figure. When the user clicks on Chart 2, only the selected value is shown in Chart 2. Because the Filter event is enabled for Table 3, the selection is applied as a filter to Table 3.
Set Maximum Connections for an Interactive Report
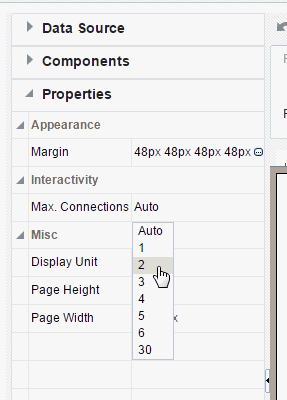
You can limit the connections from the browser to the server for the interactive viewer.
More connections are faster but increase server load. The default is six connections. Reduce the number to reduce the load on the server for large reports.
To set the maximum connections for this layout:

