Create Prompts

You create prompts to enable analysts to display the data they're interested in.

Topics:

Create Column Prompts

A prompt enables you to filter the data that you see. A column prompt enables users viewing a dashboard to select a value for a column that affects what they see on the dashboard.

Use the following procedure to create:

  • A named column prompt that you can apply to one or more dashboards.
  • An inline column prompt that is embedded in an analysis. For example, you can add a prompt to the Brand Revenue analysis so that the analysis can be reviewed for specific brands. You add a prompt directly to a column in the analysis (an inline prompt).
  1. Open the analysis for editing.
  2. On the Definition pane of the Prompts tab, click New to access the prompt type selection list. Select Column Prompt and select the appropriate column.
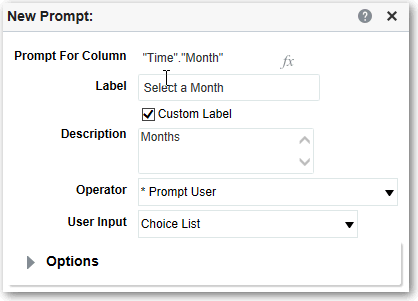
  3. Click Custom Label and enter a caption for the column filter prompt. The caption displays as the field label for the prompt.

    For example, "Select a currency."

  4. In the Description field, enter a short description for the prompt.

    This description becomes tooltip text, which is displayed when the user hovers the mouse pointer over the prompt's label in the dashboard or analysis.

  5. From the Operator list, select the operator to use, such as "is greater than." If you want the user to select the operator at runtime, then select the *Prompt User operator.

    If you’re creating a prompt that includes a group in the prompt's value selection list, then you must set the Operator to either is equal to/is in or is not equal to/is not in. See About Groups and Calculated Items.

  6. In the User Input field, select how you want the prompt interface to ask the user for input. For example, prompt the user with a radio button to select only one prompt value.
  7. Depending on the type of user input that you specified, enter the appropriate values in the User Input field.

    For example, select Custom Values to indicate that users can select from a list of prompt values that you created rather than the values supplied by the column.

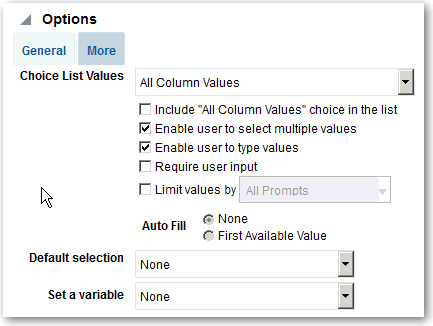
  8. Within the Options section, select prompt options to specify the display of list values and user interaction with the prompt. The prompt options vary depending on the user input type and list values type that you selected.
  9. In the Default selection field, select the prompt value or values that users see initially.

    If you select a default type, then a field is displayed where you can either select specific values, or specify how you want the default values to be determined. For example, if you select SQL Results, you must then supply a SQL statement to generate the list of values.

  10. Click OK.
  11. Click Save Prompt in the editor or save the analysis.
  12. Use the arrow buttons in the Definition pane to reorder the selected prompt. Reordering the prompts controls the order in which the choices are displayed to users at runtime.
  13. Select the type of layout you want on the prompts page by clicking New Row or New Column in the Definition pane.

    A row-based layout saves space because it organizes prompts horizontally. A column-based layout aligns prompts into neat columns. Click the boxes in the New Column or New Row column in the Definition table that correspond to where you want to add a new column or row to the prompts page.

  14. Preview the prompt with sample data using the Display pane, or click Preview (if available) in the Definition pane toolbar to view the prompt with actual prompt values.
Create Variable Prompts

A variable prompt enables the user to select a value that is specified in the variable prompt to display on the dashboard.

A variable prompt isn’t dependent upon a column, but can still use a column. You can use variable prompts to enable the user to specify existing data to perform sales projections.

For example, you can create a variable prompt called Sales Projections and specify the variable prompt values as 10, 20, and 30 percent. Then you create an analysis that contains the Region and Dollars columns. Within the Dollars column formula, you select the multiply operator and insert the Sales Projection variable. When users run this analysis, they can select a percentage by which to recalculate the Dollars column.

  1. Open the analysis for editing.
  2. Display the Prompts tab.
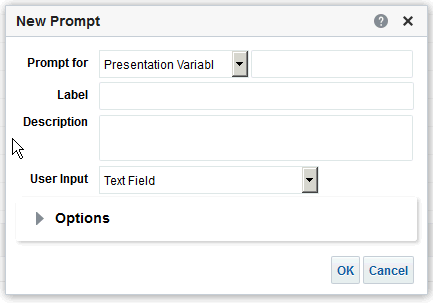
  3. On the Definition pane of the Prompts tab, click New then Variable Prompt to display the New Prompt dialog.
  4. In the Prompt for field, select the variable type that you’re creating and then enter the name of the variable.

    This variable name is the name that you add to the analysis or dashboard where you want the variable prompt's value specified by the user to display. Currently, you can create only presentation variables.

  5. In the Label field, enter a caption for the variable filter prompt. The caption is displayed as the prompt's field label.
  6. In the Description field, enter a short description for the prompt. This description is displayed as tooltip text, which is displayed when the user hovers the mouse pointer over the prompt's label in the dashboard or analysis.
  7. In the User Input field, select how you want the prompt interface to ask the user for input. For example, prompt the user with a radio button to select only one prompt value.
  8. If you selected either the Choice List, Check boxes, Radio buttons, and List box user input type, then you must also specify the prompt's list of values.
  9. Within the Options section, select the prompt options. The prompt options vary depending on the user input type that you selected.

    The prompt options enable you to further specify how you want the user to interact with the prompt. For example, whether user input is required.

  10. In the Default selection field, select the prompt value that users see initially. If you select a specific value, then the Default Value field is displayed in which you can enter a value.
  11. Click OK to display the prompt is displayed in the Definition pane.
  12. Save your changes.

Override a Selection Step with a Prompt

You can override a selection step with either a dashboard prompt or an inline prompt.

For example, you can specify that the Products.Brand selection step be overridden with a column prompt specifying the BizTech and FunPod members.

  1. Open the analysis for editing.
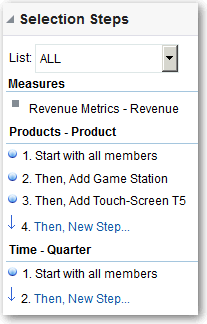
  2. In Results tab, select the columns for the analysis and then navigate to the Selection Steps pane by selecting Show/Hide Selection Steps Pane.
  3. Specify the selection steps for the analysis.
  4. Determine which selection step you want to override with a column prompt and click Edit.
  5. In the dialog, select Override with prompt, if it’s available for that type of step.
  6. Click OK and save the analysis.

Create Currency Prompts

A currency prompt enables users to change the currency type that is displayed in a dashboard or analysis.

Use this procedure to create a currency prompt that you can apply to one or more dashboards, or to create a currency prompt that's embedded in an analysis.

  1. Open the analysis for editing.
  2. Display the Prompts tab.
  3. In the Definition pane, click the New button and select Currency Prompt.
  4. In the Label field, enter a caption.
  5. In the Description field, enter a short description. This description is displayed as tooltip text, which is displayed when the user hovers the mouse pointer over the prompt's label in the dashboard or analysis.
  6. Click OK.
  7. Save the prompt.
    • If you’re creating a dashboard prompt, then click the Save button in the prompt's editor, specify the folder in which you want to save the prompt, and give the prompt a descriptive name. Dashboard prompts that are saved in personal folders are available only to you. Dashboard prompts that are saved in shared folders are available to other users that have permission to access the object.
    • If you’re creating an inline prompt, then save the analysis.
  8. Use the arrow buttons in the Definition pane to reorder the selected prompt. Reordering the prompts controls the order in which the choices are displayed to users at runtime, so ensure that the order is logical, especially if you’re creating constrained prompts.
  9. If you want to add a new row or column to the prompts page, then click the New Row button or New Column button in the toolbar. In the Definition table, click the check box corresponding to the prompt that you want to display in a new row or column.
  10. To preview how the prompt is displayed on the dashboard, either use the Display pane to preview the prompt with sample data, or click the Preview button in the toolbar to view the prompt with actual prompt values.