Link Views in Master-Detail Relationships
You can link views so that one view drives changes in other views.
For example, when you select 2011 as a 'Year' value in the master view, you see 2011 data in a chart in the detail view .
You define two views to link:
-
A master view that drives data changes in one or more detail views.
The following types of views can be master views: funnel graph, gauge, graph, heat matrix, map, pivot table, table, and trellis. In a trellis view, only on the outer edges, can be master views, not the inner visualizations.
Master views can be the same analysis as the detail view or in a different analysis.
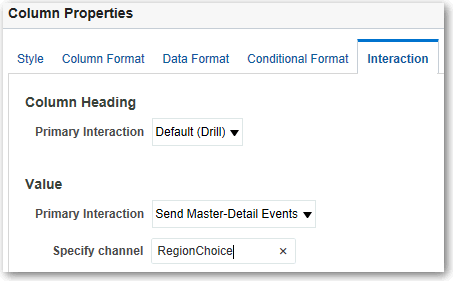
A master view contains a master column, where you set up the interaction that sends master-detail events on a channel. A channel carries master-detail events to the detail view. The master view must be displayed in the body of the view; it can’t display on the page edge or section slider.
-
A detail view that responds to events such as clicking on a value in a master view table.
The following types of views can be detail views: funnel graph, gauge, graph, heat matrix, map, pivot table, table, and trellis. In a trellis view, only the outer edge can be detail views, not the inner visualizations.
A detail view:
-
Can listen for events from multiple master views.
-
Can be in the same analysis as the master view or in a different analysis.
-
Can’t act as a master view to another view.
-
Topics
Define Master Views
As part of the process of linking views in master-detail relationships, you define the master view that sends changes to the detail views.
Define Detail Views
As part of the process of linking views in master-detail relationships, you define the detail views that receive changes from the master view.
Note: Make sure that you position the master view column (that is, the column in the master view with Primary Interaction set to “Send Master-Detail Events”) on the Prompts or Sections area of the detail view.
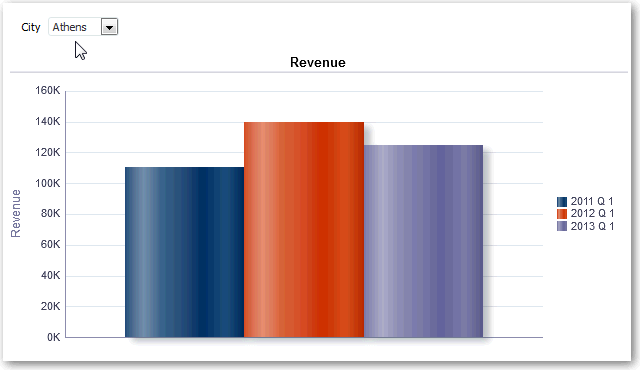
In the following example, a table view of a City Revenue analysis is linked to a bar graph through a master-detail relationship.
In the graph view, the City column is configured as the master view. The City column sends events to the graph view through the specified CityChoice channel.
The graph view has a prompt that enables users to choose a city. Data on the graph is displayed based on the city choice.
The graph is the detail view, with the City prompt listening for events from the table view on the specified CityChoice channel. Suppose the user clicks on a value in the City column in the table view. The prompt in the graph view is set to that city, and the graph is refreshed.

