Locate and Choose Visualizations Generated by Auto Insights
You can review the visualizations that Auto Insights generates and select which visualizations you want to include on the canvas.
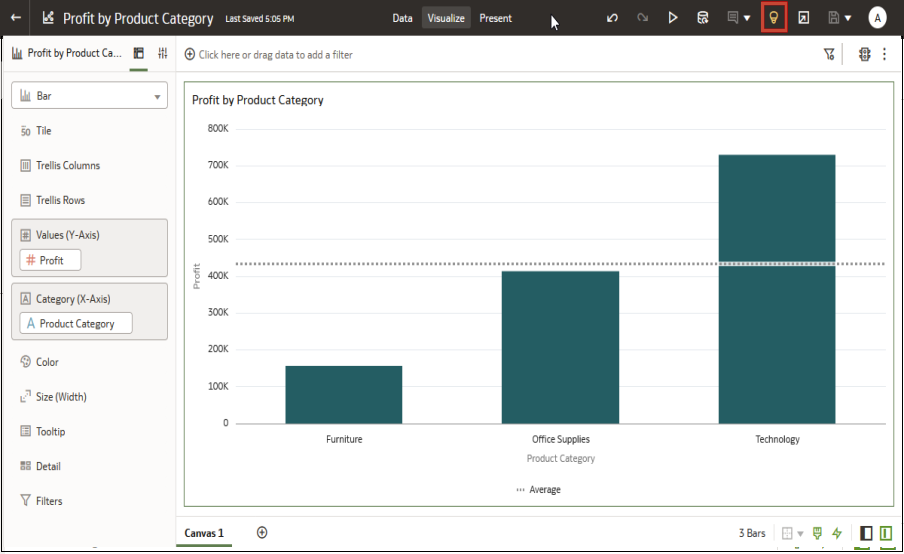
When you create or open a workbook, the Auto Insights icon is white while Oracle Analytics reviews the dataset's measures, attributes, and relationships between these data elements to determine insights. The Auto Insights icon turns yellow after Oracle Analytics completes generating insights and displays the suggested visualizations and their summaries.
To generate insights for a dataset, Auto Insights must be enabled for the dataset. See Turn Auto Insights On or Off for a Dataset.
- Create or open a workbook and display the Visualize panel.
- On the toolbar, click Auto Insights


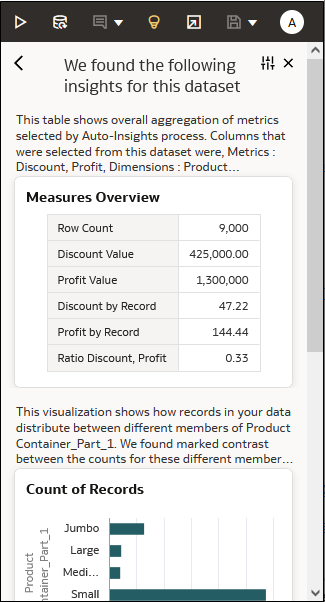
Description of the illustration autoinsights70.png - In the Auto Insights panel, hover over a visualization
that you want to include in the workbook, and click + to
add it to the workbook canvas.

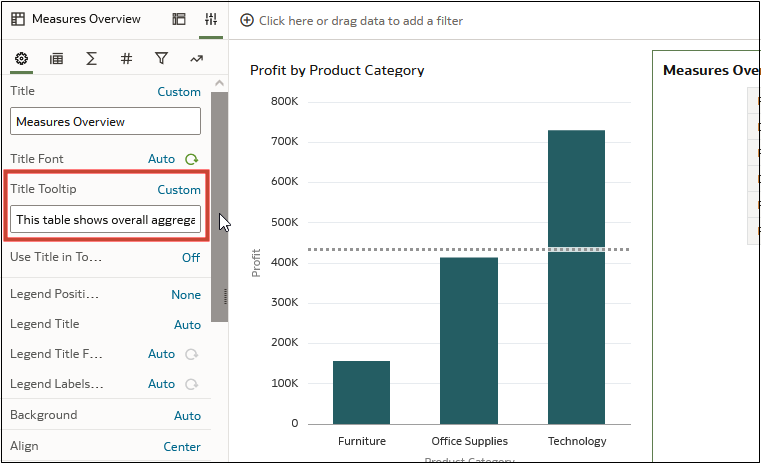
Description of the illustration autoinsights2.png - Optional: In the visualization's Grammar Panel, click Properties,
and in the Title Tooltip field, inspect the
visualization's natural language summary.

Description of the illustration autoinsights4.png - Click Save.