Specify the Visualization Types that Auto Insights Displays
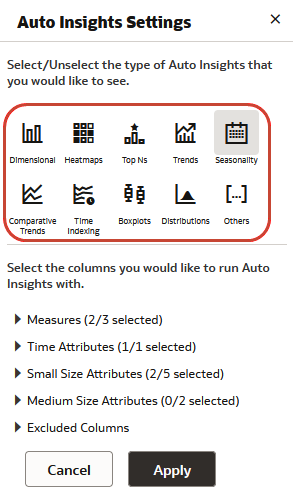
By default, Oracle Analytics uses all visualization types (for example, dimensional, heat maps, trends) to display insights for a dataset. To focus on specific relationships in the data, you can specify which visualization types you want Auto Insights to display.
For example, suppose you want to find the seasonality behavior of
sales by ship date to determine if there is a significant increase or decrease of sales
during a specific shipment time period. In the Auto Insight settings you deselect all
visualization types except Seasonality.
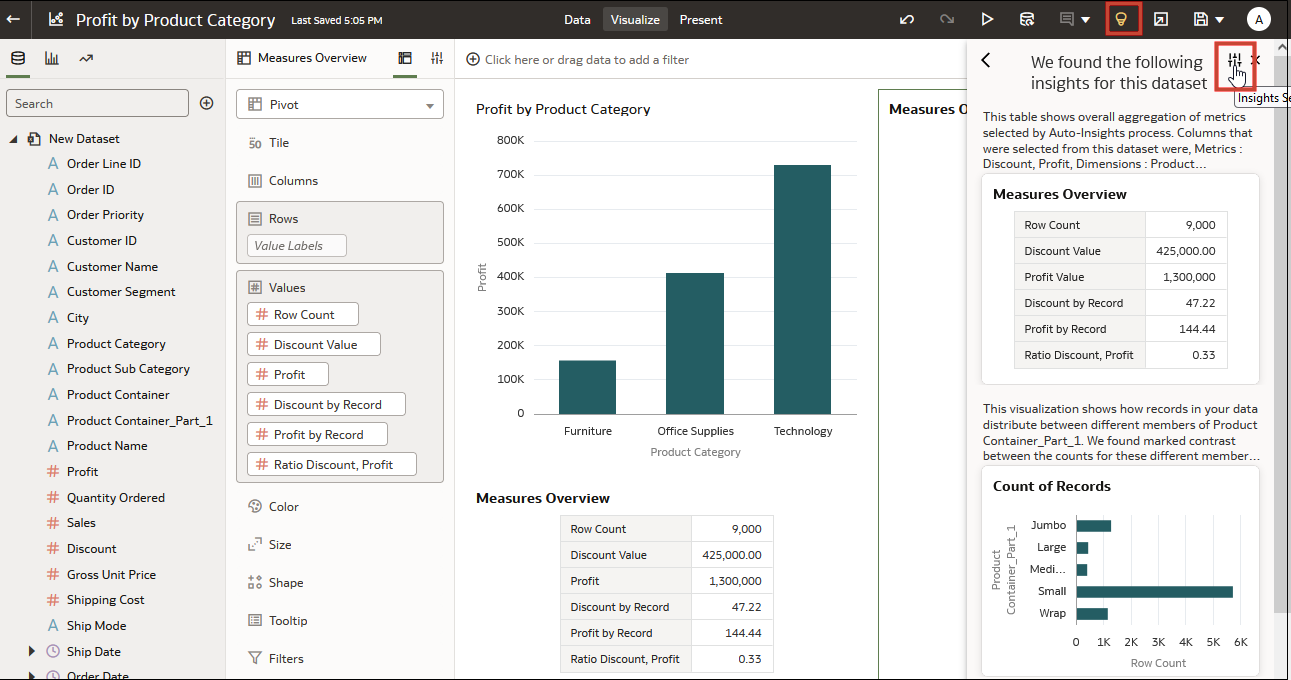
- Click Auto Insights, then click Insights
Settings.
- Click the tiles corresponding to the visualization types that you don't want to
display.
- Click Apply.

