1 Troubleshooting Oracle Stream Analytics
Oracle Stream Analytics is used to analyze and monitor a stream of events in real-time. You can create pipelines to model the stream processing solutions. Typically, an Oracle Stream Analytics pipeline runs continuously for long durations until it is stopped explicitly, or it fails. This document provides information needed to troubleshoot various issues that you might encounter while creating, executing, or deploying a pipeline.
1.1 Pipeline Debug and Monitoring Metrics
For every running Oracle Stream Analytics pipeline, there is a corresponding spark application deployed to the Spark Cluster. If Oracle Stream Analytics pipeline is deployed and running in draft mode or published mode, user can monitor and analyze the corresponding Spark application using real-time metrics provided by Oracle Stream Analytics. These metrics provide detailed run-time insights for every pipeline stage and user can drill down to operator level details. Note that these metrics are in addition to metrics provided by Spark. For each application, Oracle Stream Analytics provides detailed monitoring metrics which user can use to analyze if pipeline is working as per expectation.
1.1.1 Spark Standalone
When running on Spark Standalone, the Spark Master URL is same as the host name in Spark REST URL field plus the Spark standalone master console port field. Spark Master URL is http://<Spark REST URL>:< Spark standalone master console port>. You can obtain Spark Master URL from the System Settings page.
The Spark Master page also displays a list of running applications. Click on an application to see details such as application ID, name, owner, current status.
For pipelines in 'Published' status, you can navigate to the metrics console from GGSA’s catalog page as shown in the screenshot below.
![]()
![]()
1.1.2 Spark on YARN
For published pipelines it is easier to navigate to Application Master console from GoldenGate Stream Analytics' catalog page.
- For draft pipelines, you can navigate to YARN Applications page using the YARN Resource Manager URL and YARN Master console port values in System Settings.
-
Application master url is
http://<YARN Resource Manager URL>:<Yarn master Console Port>.This page displays all the applications running in YARN:

-
After identifying the application from the list, click the ApplicationMaster link, to open the Spark Application Details page:
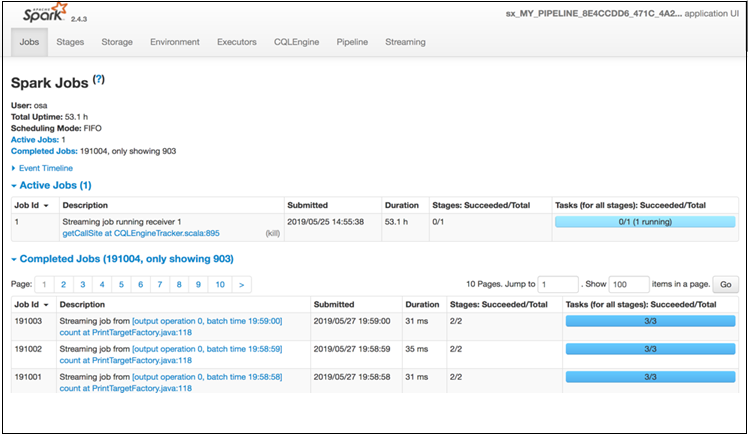
1.1.3 Pipeline Details
Click the Pipeline tab to view the Pipeline details page. 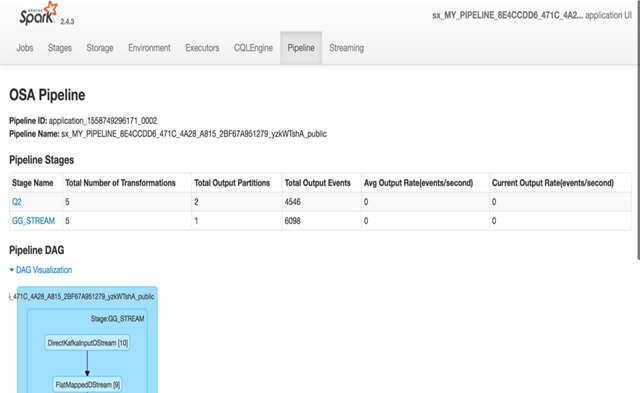
Description of the illustration pipeline_details_page.png
This page has following information about a pipeline:
-
Pipeline ID: Unique pipeline id in Spark Cluster
-
Pipeline Name: Name of Oracle Stream Analytics Pipeline given by user in Oracle Stream Analytics UI.
-
Pipeline Stages Table: This section displays a table having detailed runtime metrics of each pipeline stage. Each entry in the table is corresponding to a pipeline stage in Oracle Stream Analytics UI pipeline graph.
-
Pipeline DAG: This is a visual representation of all stages in form of a DAG where it displays the parent-child relation various pipeline stages. This diagram also shows the information about the transformations in each of the pipeline stage.
-
The Pipeline Stages table contains the following columns.
-
Total Number of Transformations: This measurement is number of spark transformations applied to compute each stage.
Oracle Stream Analytics supports various types of stages e.g. Query Stage, Pattern Stage, Custom Stage etc. For each pipeline stage, Oracle Stream Analytics defines a list of transformations which will be applied on the input stream for the stage. The output from final transformation will be the output of stage.
-
Total Output Partitions: This measurement is total number of partitions in the output stream of each stage.
Every pipeline stage has its own partitioning requirements which are determined from stage configurations. For example, If a QUERY stage defines a summary function and doesn't define a group-by column, then QUERY stage will have only one partition because there will be no partitioning criteria available.
-
Total Output Events: This measurement is total number of output events (not micro-batches) emitted by each stage.
-
Average Output Rate: This measurement is the rate at which each stage has emitted output events so far. The rate is a ratio of total number of output events so far and total application execution time.
If the rate is ZERO, then it doesn't always mean that there is ERROR in stage processing. Sometime stage doesn't output any record at all (e.g. No event passed the Filter in Query stage).This can happen if rate of output events is less than 1 events/second.
-
Current Output Rate: This measurement is the rate at which each stage is emitting output events. The rate is ratio of total number of output events and total application execution time since last metrics page refresh. To get better picture of current output rate, please refresh the page more frequently.
1.1.4 Stage Details
Click a Name in the Name column of the Pipeline Stages table to navigate to stage details page. 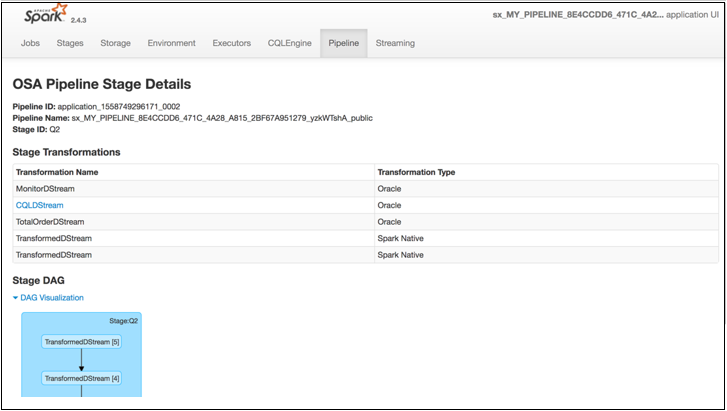
-
Pipeline ID: Unique pipeline id in Spark Cluster
-
Pipeline Name: Name of Oracle Stream Analytics Pipeline given by user in Oracle Stream Analytics UI.
-
Stage ID: Unique stage id in DAG of stages for Oracle Stream Analytics Pipeline.
-
Stage DAG: This is a visual representation of all transformations in form of a DAG where it displays the parent-child relation various pipeline transformations.
Note Oracle Stream Analytics allows different transformation types including Business Rules but drilldowns are allowed only on CQLDStream transformations. Inside CQLDStream transformation, the input data is transformed using a continuously running query (CQL) in a CQL Engine. Note that there will be one CQL engine associated with one Executor.
-
Stage Transformations Table:This table displays details about all transformations being performed in a specific stage. Each entry in the table is corresponding to a transformation operation used in computation of the stage. You can observe that final transformation in every stage is MonitorDStream. The reason is that MonitorDStream pipes output of stage to Oracle Stream Analytics UI Live Table.
-
Transformation Name: Name of output DStream for the transformation. Every transformation in spark results into an output dstream.
-
Transformation Type: This is category information of each transformation being used in the stage execution. If transformation type is "Oracle", it is based on Oracle's proprietary transformation algorithm. If the transformation type is "Native", then transformation is provided by Apache Spark implementation.
-
CQLDStream transformation allows further drill down as described in the Query Details section.
1.1.5 Query Details
In the Stage Transformation table, click on a CQLDStream transformation to open CQL Engine Summary page for query-specific details.
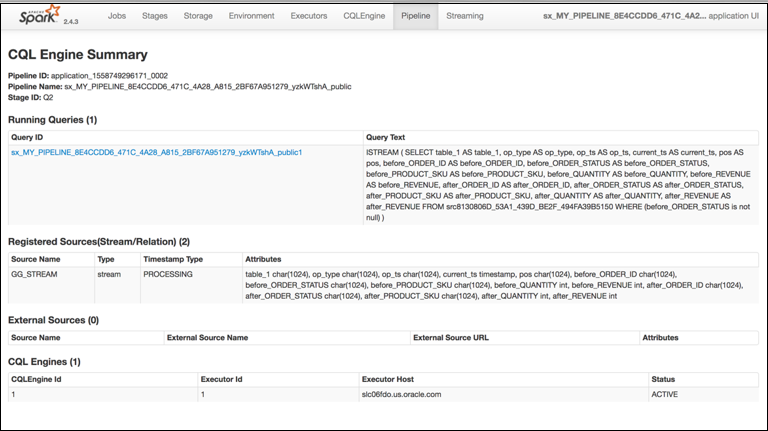
The CQL Engine Summary page for the query has details like query text, stream sources feeding the query, external sources if any and all CQL engines with which the query is registered.
1.1.6 Execution and HA Statistics
Click on a Query, in the CQL Engine Summary page.
You can view the Execution and HA statistics, in the CQL Engine Query details page that is displayed.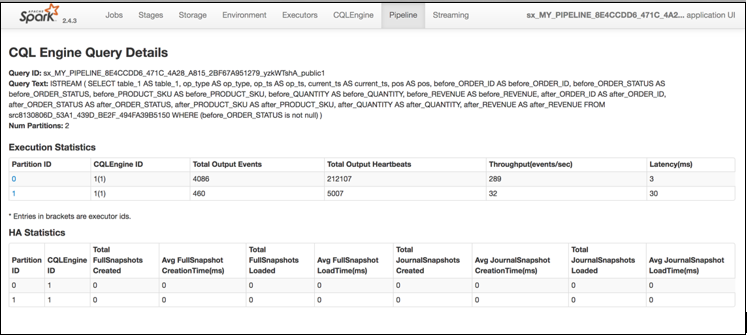
1.1.7 Detailed Query Analysis
Click on a specific partition in Execution Statistics table, the CQL Engine Detailed Query Analysis page is displayed.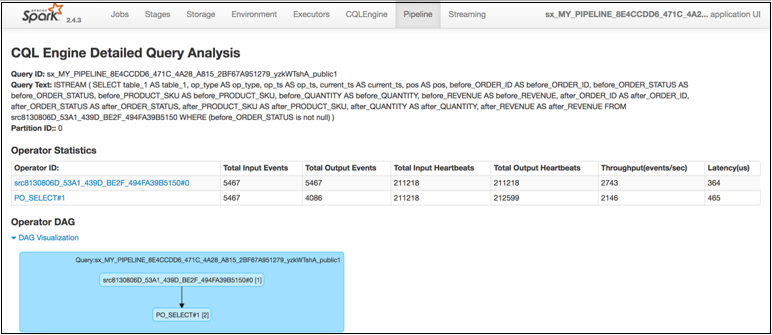
This page contains details about each execution operator of CQL query for a particular partition of a stage in pipeline.
-
Query ID: System generated identifier for query
-
Query Text: Query String
-
Partition ID: All operator details are corresponding to this partition id.
-
Operator Statistics:
-
Operator ID: System Generated Identifiers
-
Total Input Events: Total number of input events received by each operator.
-
Total Output Events: Total number of output events generated by each operator.
-
Total Input Heartbeats: Total number of heartbeat events received by each operator.
-
Total Output Heartbeats: Total number of heartbeat events generated by each operator.
-
Throughput(events/second): Ratio of total input events processed and total time spent in processing for each operator.
-
Latency(ms): Total turnaround time to process an event for each operator.
-
-
Operator DAG: This is visual representation of the query plan. The DAG will show the parent-child details for each operator. You can further drill down the execution statistics of operator. Please click on the operator which will open CQL Operator Details Page.
1.1.8 Complete CQL Engine Statistics
Click on the CQL Engine tab, to view the complete CQL engine statistics for all stages and all queries in the Pipeline.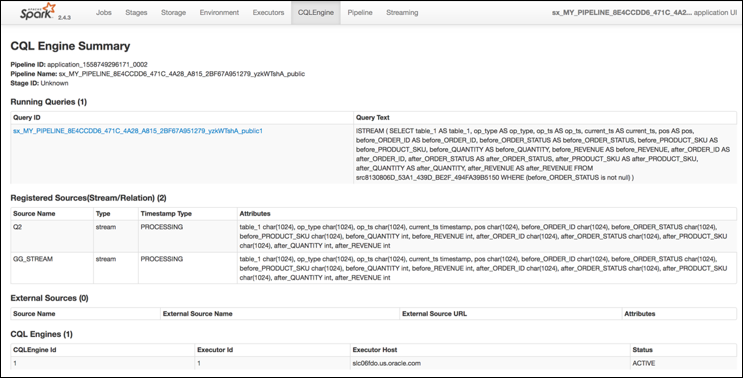
This page contains additional information about each execution operator, apart from the CQL Engine Query Details page, provides all essential metrics for each operator.
Pipeline ID: Unique pipeline id in Spark Cluster
Pipeline Name: Name of Oracle Stream Analytics Pipeline given by user in Oracle Stream Analytics UI.
Stage ID: Unique stage ID in DAG of stages for Oracle Stream Analytics Pipeline.
Running Queries: This section displays list of CQL queries running to compute the CQL transformation for a stage. This table displays a system-generated Query ID and Query Text. Check Oracle Continuous Query Language Reference for CQL Query syntax and semantics. To see more details about query, click on the query id hyperlink in the table entry to open CQL Engine Query Details page.
Registered Sources: This section displays internal CQL metadata about all the input sources which the query is based upon. For every input stream of the stage, there will be one entry in this table.
Each entry contains source name, source type, timestamp type and stream attributes. Timestamp type can be PROCESSING or EVENT timestamped. If stream is PROCESSING timestamped, then timestamp of each event will be defined by system. If stream is EVENT timestamped, then timestamp of each event is defined by one of the stream attribute itself. A source can be Stream or Relation.
External Sources: This section displays details about all external sources with which input stream is joined. The external source can be a database table or coherence cache.
CQL Engines: This section displays a table having details about all instances of CQL engines used by the pipeline. Here are details about each field of the table:
- CQLEngine Id: System generated id for a CQL engine instance.
- ExecutorId: Executor Id with which the CQL engine is associated.
- Executor Host: Address of the cluster node on which this CQL engine is running.
- Status: Current Status of CQL Engine. Status can be either ACTIVE or INACTIVE. If it is ACTIVE, it means that CQL Engine instance is up and running, Otherwise CQL Engine is stopped explicitly.
1.1.9 Internal Kafka Topics
The internal Kafka topics and Group ID's used by GGSA are standardized to the following naming conventions:
Kafka Topics
| Topic | Resource | Operations |
|---|---|---|
|
sx_backend_notification_<UUID> |
Topic | CREATE,DELETE,DESCRIBE,READ,WRITE |
|
sx_messages_<UUID> |
Topic | CREATE,DELETE,DESCRIBE,READ,WRITE |
|
sx_<application_name>_<stage_name>_public |
Topic | CREATE,DELETE,DESCRIBE,READ,WRITE |
|
sx_<application_name>_<stage_name>_draft |
Topic | CREATE,DELETE,DESCRIBE,READ,WRITE |
|
sx_<application_name>_public_<offset_number>_<stage_name>_offset |
Topic | CREATE,DELETE,DESCRIBE,READ,WRITE |
Group IDs
| Group ID | Resource | Operations |
|---|---|---|
|
sx_<UUID>_receiver |
Group | DESCRIBE, READ |
|
sx_<UUID> |
Group | DESCRIBE, READ |
|
sx_<application_name>_public_<offset_number>_<stage_name> |
Group | DESCRIBE, READ |
1.2 Common Issues and Remedies
This section provides a comprehensive list of items to verify if pipelines are not running as expected.
1.2.1 System Settings
Common issues encountered in System Settings are listed in this section.
1.2.1.1 SQL Queries Configuration
When you a create a custom query from the SQL queries configuration in System Settings, to access a table to look-up, the pipeline fails, unless you create a synonym with the table name.
OSA2.REF_TBL from user OSA1, create a synonym from user OSA1 usingCreate synonym REF_TBL for OSA2.REF_TBL1.2.1.2 VM Memory Issue in Yarn Cluster
If the Ignite server is unable to start successfully on yarn cluster, check if there is a VM memory issue in yarn cluster.
yarn-site.xml and restart the yarn cluster.<property>
<name>yarn.nodemanager.vmem-check-enabled</name>
<value>false</value>
</property>
1.2.3 Pipeline
Common issues encountered while deploying pipelines are listed in this section.
1.2.3.1 Unable to Deploy more than 17 Pipelines
The default Spark setup is set to a maximum of 16 pipelines.
- Open an SSH terminal on the GGSA instance
- run
mysql -uroot -p - Enter the password mentioned in
/home/opc/README.txt - mysql> use
OSADB - mysql> insert into
osa_system_property(mkey,value) values('spark.port.maxRetries','40'); - Restart GGSA by running
sudo systemctl restart osa
Ensure that the environment has sufficient core and memory resources in Spark for the required number of pipelines.
1.2.3.2 Pipelines are not running as expected
If a pipeline is not running as expected, verify the following:
Ensure that Pipeline is Deployed Successfully
-
Open Spark Master console user interface.
-
If you see the status as
Running, then the pipeline is currently deployed and running successfully.
Ensure that the Input Stream is Supplying Continuous Stream of Events to the Pipeline
-
Go to the Catalog.
-
Locate and click the stream you want to troubleshoot.
-
Check the value of the topicName property under the Source Type Parameters section.
-
Since this topic is created using Kafka APIs, you cannot consume this topic with REST APIs.
Listen to the Kafka topic hosted on a standard Apache Kafka installation.
You can listen to the Kafka topic using utilities from a Kafka Installation.
kafka-console-consumer.shis a utility script available as part of any Kafka installation.Follow these steps to listen to Kafka topic:
-
Determine the Zookeeper Address from Apache Kafka Installation based Cluster.
- Use the following command to listen the Kafka topic:
./kafka-console-consumer.sh --zookeeper IPAddress:2181 --topicName
-
Ensure that the Output Stream is available in the Monitor Topic
-
Navigate to Catalog.
-
Open the required pipeline.
-
Ensure that you stay in pipeline editor and do not click Done. Otherwise the pipeline gets undeployed.
-
Right-click anywhere in the browser and select Inspect.
-
Go to WS tab under the Network tab.
-
Refresh the browser.
New websocket connections are created.
-
Locate a websocket whose URL has a parameter with the name
topic.The value of topic
paramis the name of Kafka Topic where the output of this stage (query or pattern) is pushed.
Description of the illustration ws_network.pngThe topic name is
AppName_StageId. The pipeline name can be derived from topic name by removing the_StageIDfrom topic name. In the above snapshot, the pipeline name issx_2_49_12_pipe1_draft.
-
Go to Spark application master UI.
-
Open Pipeline Summary Page after clicking on Pipeline Tab. The pipeline summary page shows a table of stages with various metrics.
-
Click on the stage id corresponding to the Query stage of the pipeline in which you're correlating stream with reference.
-
In the Pipeline Stage Details page, click the CQLDStream stage to open CQL Engine Summary page.
-
In the CQL Engine Summary page, locate the External Sources section. Note the source id for the reference which is used in stage.
-
Open the CQL Engine Detailed Query Analysis page.
-
Click the operator that has the operator id same as source id to open CQL Engine Detailed Operator Analysis page. Click the entry corresponding to the operator.
-
Look for the Cache Statistics section. If there is no such section, then caching is not enabled for the stage. If you see the non-zero entries in Cache Hits and Cache Misses, then caching is enabled and active for the pipeline stage.
1.2.3.3 GGSA Pipeline getting Terminated
A GGSA pipeline can terminate if the targets and references used the pipeline are unreachable or resources are unavailable. You can could see following exceptions on the logs:
com.tangosol.net.messaging.ConnectionException
SQLException in the Spark logs.
In case of a kafka source, republish the pipeline to read records from where it left off before terminating.
1.2.3.4 Live Table Shows Listening Events with No Events in the Table
There can be multiple reasons why status of pipeline has not changed to Listening Events from Starting Pipeline. Following are the steps to troubleshoot this scenario:
-
The live table shows output events of only the currently selected stage. At any time, only one stage is selected. Try switching to a different stage. If you observe output in live table for another stage, the problem can be associated with the stage. To debug further, go to step 5.
If there is no output in any stage, then move to step 2.
-
Ensure that the pipeline is still running on Spark Cluster. See Ensure that the Pipeline is Deployed Successfully
-
If the Spark application for your pipeline is killed or aborted, then it suggests that the pipeline has crashed. To troubleshoot further, you may need to look into application logs.
-
If application is in ACCEPTED, NEW or SUBMITTED state, then application is waiting for cluster resource and not yet started. If there are not enough resources, check the number of VCORES in Big Data Cloud Service Spark Yarn cluster. For a pipeline, Stream Analytics requires minimum 3 VCORES.
-
If application is in RUNNING state, use the following steps to troubleshoot further:
-
Ensure that the input stream is pushing events continuously to the pipeline.
-
If the input stream is pushing events, ensure that each of the pipeline stages is processing events and providing outputs.
-
If both of the above steps are verified successfully, then ensure that the pipeline is able to push the output events of each stage to its corresponding monitor topic:
-
Determine the monitor topic for the stage, where the output of stage is being pushed into. See Determine the Topic Name where Output of Pipeline Stage is Propagated .
-
Listen to the monitor topic and ensure that the events are continuously being pushed in topic. To listen to the Kafka topic, you must have access to Kafka cluster where topic is created. You can listen to the Kafka topic using utilities from a Kafka Installation.
kafka-console-consumer.shis a utility script available as part of any Kafka installation. -
If you don't see any events in the topic, then this can be an issue related to writing output events from stage to monitor topic. Check the server logs and look for any exception and then report to the administrator.
-
If you can see outputs events in monitor topic, then the issue can be related to reading output events in web browser.
-
-
Determine the Topic Name where Output of Pipeline Stage is Propagated
Here are the steps to find the topic name for a stage:
-
Open the Pipeline Summary Page for your pipeline. If you don't know the corresponding application name for this pipeline, see Ensure that the Output Stream is available in the Monitor Topic for instructions.
-
This page will provide the Pipeline Name and various stage ids. For every pipeline stage, you will see an entry in the table.
-
For every stage, the output topic id will be PipelineName_StageID.
-
Click Done in the pipeline editor and then go back to Catalog and open the pipeline again.
1.2.3.5 Live Table Still Shows Starting Pipeline
There can be multiple reasons why status of pipeline has not changed to Listening Events from Starting Pipeline. Following are the steps to troubleshoot this scenario:
-
Ensure that the pipeline has been successfully deployed to Spark Cluster. For more information, see Ensure that Pipeline is Deployed Successfully . Also ensure that the Spark cluster is not down and is available.
-
If the deployment failed, check the Jetty logs to see the exceptions related to the deployment failure and fix the issues.
-
If the deployment is successful, verify that OSA webtier has received the pipeline deployment from Spark.
-
Click Done in the pipeline editor and then go back to Catalog and open the pipeline again.
Ensure that a Pipeline Stage is Still Processing Events
-
Go to Spark application master UI.
-
Open Pipeline Summary Page after clicking on Pipeline Tab. The pipeline summary page shows a table of stages with various metrics.
-
Check if Total Output Events is a non-zero value. Refresh the page to see if the value increases or stays the same. If the value remains same and doesn't change for a long time, then drill down into stage details.
1.2.3.6 Time-out Exception in the Spark Logs when you Unpublish a Pipeline
In the Jetty log look for the following message:
OsaSparkMessageQueue:182 - received: oracle.wlevs.strex.spark.client.spi.messaging.AcknowledgeMessage Undeployment Ack: oracle.wlevs.strex.spark.client.spi.messaging.AcknowledgeMessage
During an application shutdown, a pipeline may take several minutes to unpublish completely.
So, if you do not see the above message, then you may need to increase the osa.spark.undeploy.timeout value accordingly.
Also in the High Availability mode, at the time of unpublishing a pipeline, the snapshot folder is deleted.
In HA mode, if you do not receive the above error message on time, and see the following error:
Undeployment couldn't be complete within 60000 the snapshot folder may not be completely cleaned.
it only means that the processing will not be impacted, but some disk space will be occupied.
1.2.3.7 Piling up of Queued Batches in HA mode
1.2.3.8 Null Record from Summary in Query Stage
When you publish a pipeline for the first time, with a summary in one of the Query stages, the first record is null on all columns. This causes the pipeline to fail, if it has targets where key is necessary.
To solve this issue, check if there is a summary stage added before a target stage, and add a query stage with a filter checking for null values for the cache keys.
1.2.4 Stream
Common issues encountered with streams are listed in this section.
1.2.4.1 Cannot See Any Kafka Topic or a Specific Topic in the List of Topics
Use the following steps to troubleshoot:
-
Go to Catalog and select the Kafka connection which you are using to create the stream.
-
Click Next to go to Connection Details tab.
-
Click Test Connection to verify that the connection is still active.
-
Ensure that topic or topics exist in Kafka cluster. You must have access to Kafka cluster where topic is created. You can list all the Kafka topics using utilities from a Kafka Installation.
kafka-console-consumer.shis a utility script available as part of any Kafka installation. -
If you can't see any topic using above command, ensure that you create the topic.
-
If the test connection failed, and you see error message like
OSA-01266 Failed to connect to the ZooKeeper server, then the Kafka cluster is not reachable. Ensure that Kafka cluster is up and running.
1.2.4.2 Input Kafka Topic is Sending Data but No Events Seen in Live Table
This can happen if the incoming events are not adhered to the expected shape for the Stream. To check if the events are dropped due to shape mismatch, use the following steps to troubleshoot:
-
Verify if lenient parameter under Source Type Properties for the Stream is selected. If it is FALSE, then the event may have been dropped due to shape mismatch. To confirm this, check the application logs for the running application.
-
If the property is set to TRUE, debug further:
-
Make sure that Kafka Cluster is up and running. Spark cluster should be able to access Kafka cluster.
-
If Kafka cluster is up and running, obtain the application logs for further debugging.
-
1.2.5 Connection
Common issues encountered with connections are listed in this section.
1.2.5.1 Database Connection Failure
To test a Database connection:
-
From the Catalog page, select the database connection that you want to test.
-
Click Next.
-
On the Connection Details tab, click Test Connection.
- If the test is successful, it indicates that the connection is active.
-
If the test fails, the following error messages are displayed:
-
OSA-01260 Failed to connect to the database. IO Error: The Network Adapter could not establish the connection: This error message indicates that the DB host is not reachable from GGSA design time. -
OSA-01260 Failed to connect to the database. ORA-01017: invalid username/password; logon denied: This error message indicates that your login credentials are incorrect.
-
1.2.5.2 Druid Connection Failure
To test a Druid connection:
-
From the Catalog page, select the Druid connection that you want to test.
-
Click Next.
-
On the Connection Details tab, click Test Connection.
- If the test is successful, it indicates that the connection is active.
-
If the test fails, the following error message is displayed:
OSA-01460 Failed to connect to the druid services at zooKeeper server: This error indicates that the druid zookeeper is not reachable. Ensure that the druid services and zookeeper cluster are up and running.
1.2.5.3 Coherence Connection Failure
GGSA does not provide a Test connection option for a coherence cluster. Refer to Oracle Coherence documentation to find utilities and tools to test a coherence connection.
1.2.5.4 JNDI Connection Failure
To test a JNDI connection:
-
From the Catalog page, select the JNDI connection that you want to test.
-
Click Next.
-
On the Connection Details tab, click Test Connection.
- If the test is successful, it indicates that the connection is active.
-
If the test fails, the following error messages are displayed:
-
OSA-01707 Communication with server failed. Ensure that server is up and server url(s) are specified correctly: This error indicates that either the server is down or server url(s) is incorrectly specified. Server url should be of the formathost1:port1,host2:port2. -
OSA-01706 JNDI connection failed. User: weblogic, failed to be authenticated: This error indicates that the login credentials are incorrect.
-
1.2.7 Geofence
Common issues encountered with geofences are listed in this section.
1.2.7.1 Name and Description Fields are not displayed for the DB-based Geofences
If name and description fields are not displayed for database-based geofence, ensure to follow steps mentioned below:
-
Go to Catalog and click Edit for the required database-based geofence.
-
Click Edit for Source Type Properties and then Next.
-
Ensure that the mapping for Name and Description is defined in Shape section.
-
Once these mappings are defined, you can see the name and description for the geofence.
1.2.7.2 DB-based Geofence is not Working
To ensure that a database-based geofence is working:
-
Go to Catalog and open the required database-based geofence.
-
Ensure that the connection used in geofence is active by clicking test button in database connection wizard.
-
Ensure that table used in geofence is still valid and exists in DB.
-
Go to the geofence page and verify that the issue is resolved.
1.2.8 Cube
Common issues encountered with cubes are listed in this section.
1.2.8.1 Unable to Explore Cube which was Working Earlier
If you are unable to explore a cube which was working earlier, follow the steps mentioned below:
-
Check if the druid zookeeper or the associate services for indexer, broker, middle manager or overlord is down.
-
Click the Druid connection and navigate to next page.
-
Test the connection. This step will tell you if the services are down and need to be looked into.
1.2.8.2 Cube Displays "Datasource not Ready"
If you keep seeing “Datasource not Ready” message when you explore a cube, follow the steps mentioned below:
-
Go to the druid indexer logs. Generally, it is
http:/DRUID_HOST:3090/console.html. -
Look for entry in running tasks index_kafka_<cube-name>_<somehash>. If there is no entry in running tasks, look for the same entry in pending tasks or completed tasks.
-
If the entry lies in pending tasks, it means that workers are running out of capacity and datasource will get picked for indexing as soon as it's available.
-
In such cases, either wait OR increase the worker capacity and restart druid services OR kill some existing datasource indexing tasks (they will get started again after sometime).
-
If the entry lies in completed tasks with "FAILED" status, it means that indexing failed either due to incorrect ingestion spec or due to resource issue.
-
You can find the exact reason by clicking "log (all)" link and navigating to the exception.
-
If it is due to ingestion, try changing the timestamp format. (Druid fails to index, if the timestamp is not in JODA timeformat OR if the timeformat specified does not match with format of timestamp value).
1.2.9 Dashboard
Common issues encountered with dashboards are listed in this section.
1.2.9.1 Visualizations Appearing Earlier are No Longer Available in Dashboard
Use the following steps to troubleshoot:
-
For missing streaming visualization, it might be due to the following reasons:
-
Corresponding pipeline/stage for the missing visualizations no longer exists
-
The visualization itself is removed from catalog or the pipeline editor
-
-
For missing exploration visualization (created from cube), it might happen as cube or visualization might have been deleted already.
1.2.9.2 Dashboard Layout Reset after You Resized/moved the Visualizations
Use the following steps to troubleshoot:
-
This might happen, if you forget to save the dashboard after movement/ resizing of visualizations.
-
Make sure to click Save after changing the layout.
1.2.9.3 Streaming Visualizations Do not Show Any Data
Use the following steps to troubleshoot:
-
Go to visualization in pipeline editor and make sure that live output table is displaying data.
-
If there is no output, ensure that the pipeline is deployed and running on cluster. Once you have the live output table displaying data, it shows up on the streaming visualization.
1.2.10 Live Output
Common issues encountered with live output are listed in this section.
1.2.10.1 Issues with Live Output
For every pipeline, there will be one Spark streaming pipeline running on Spark Cluster. If a Stream Analytics pipeline uses one or more Query Stage or Pattern Stage, then the pipeline will run one or more continuous query for each of these stages.
For more information about continuous query, see Understanding Oracle CQL.
Ensure that CQL Queries for Each Query Stage Emit Output
To check if the CQL queries are emitting output events to monitor CQL Queries using CQL Engine Metrics:
-
Open CQL Engine Query Details page. For more information, see Access CQL Engine Metrics.
-
Check that at least one partition has Total Output Events greater than zero under the Execution Statistics section.
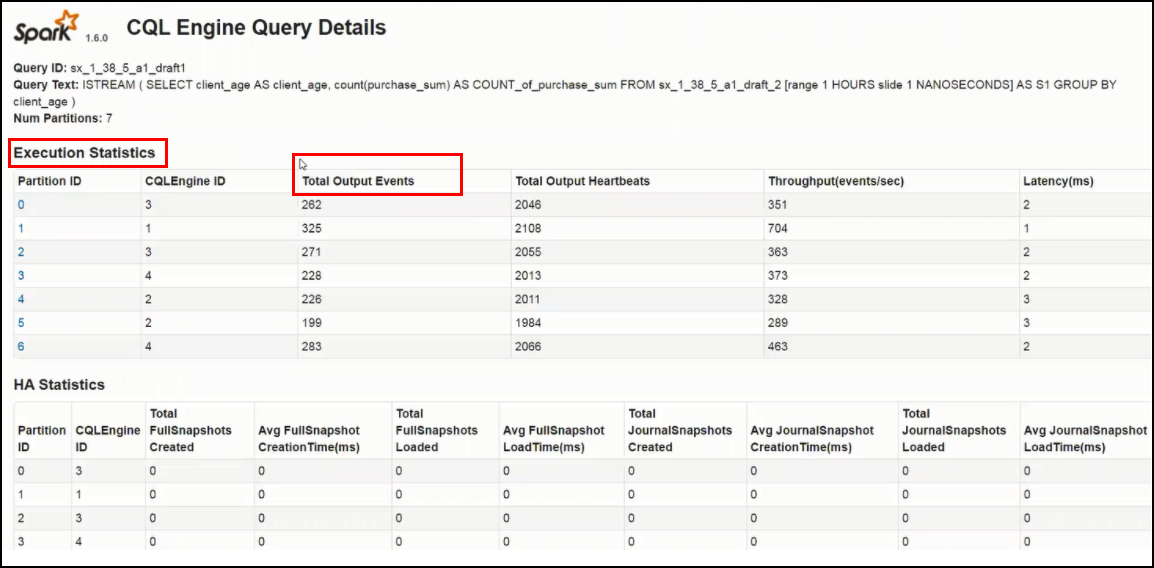
Description of the illustration cql_engine_query_details.pngIf your query is running without any error and input data is continuously coming, then the Total Output Events will keep rising.
Ensure that the Output of Stage is Available
-
Ensure that you stay in the Pipeline Editor and do not click Done. Else, the pipeline gets undeployed.
-
Right-click anywhere in the browser and click Inspect.
-
Select Network from the top tab and then select WS.
-
Refresh the browser.
New websocket connections are created.
-
Locate a websocket whose URL has a parameter with name
topic.The value of the topic param is the name of the Kafka topic where the output of this stage is pushed.
-
Listen to the Kafka topic where output of the stage is being pushed.
Since this topic is created using Kafka APIs, you cannot consume this topic with REST APIs. Follow these steps to listen to the Kafka topic:
-
Listen to the Kafka topic hosted on a standard Apache Kafka installation.
You can listen to the Kafka topic using utilities from a Kafka Installation.
kafka-console-consumer.shis a utility script available as part of any Kafka installation.To listen to Kafka topic:
-
Determine the Zookeeper Address from Apache Kafka Installation based Cluster.
- Use following command to listen the Kafka topic:
./kafka-console-consumer.sh --zookeeper IPAddress:2181 --topic sx_2_49_12_pipe1_draft_st60
-
-
1.2.10.2 Missing Events due to Faulty Data
If the CQLEngine encounters faulty data in user defined functions, the exceptions of the events with faulty data are logged in executor logs, and the processing continues uninterrupted.
Sample logs of the dropped events and exceptions:
20/04/02 14:41:42 ERROR spark: Fault in CQL query processing.
Detailed Fault Information [Exception=user defined function(oracle.cep.extensibility.functions.builtin.math.Sqrt@74a5e306)
runtime error while execution,
 Service-Name=SparkCQLProcessor, Context=phyOpt:1; queries:sx_SquareRootPipeline_osaadmin_draft1
20/04/02 14:41:42 ERROR spark: Continue on exception by dropping faulty event.20/04/02 14:41:42 ERROR spark: Dropped event details <TupleValue><ObjectName>sx_SquareRootPipeline_osaadmin_draft_1</ObjectName><Timestamp>1585838502000000000</Timestamp>
<TupleKind>PLUS</TupleKind><IntAttribute name="squareNumber"><Value>-2</Value></IntAttribute><IsTotalOrderGuarantee>true</IsTotalOrderGuarantee></TupleValue>:1.2.11 Pipeline Deployment Failure
Sometimes pipeline deployment fails with the following exception:
Spark pipeline did not start successfully after 60000 ms.
This exception usually occurs when you do not have free resources on your cluster.
Workaround:
Use external Spark cluster or get better machine and configure the cluster with more resources.
