10.1.6 Execution and HA Statistics
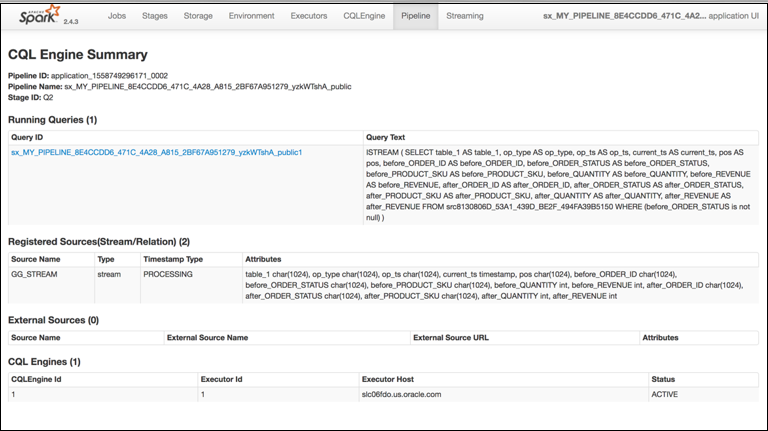
Click on a Query, in the CQL Engine Summary page.
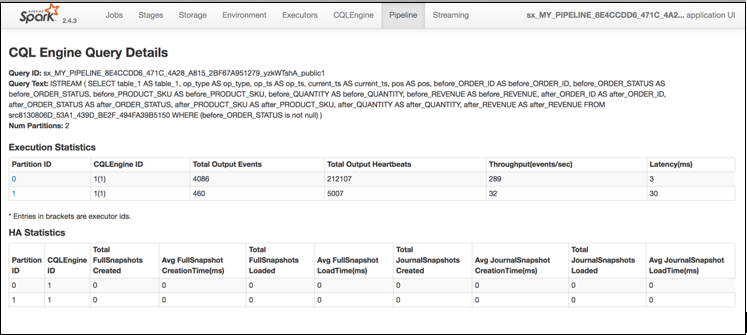
You can view the Execution and HA statistics, in the CQL Engine Query details page that is displayed.
- Following are the details displayed on this page:
-
Query ID: System generated identifier for query
-
Query Text: Query String
-
Number of Partitions: This fields shows the degree of parallelism of the query. The degree of parallelism is defined by total number of input partitions processed by a query.
Degree of parallelism depends on the many factors such as query constructs, number of input kafka partitions and number of executors assigned to application.
-
Execution Statistics Table: This section shows the detailed execution statistics of each operator.
- Partition ID: Partition Sequence Id
-
CQL Engine ID: Sequence ID of CQL Engine on which the partition is being processed.
-
Total Output Events: Number of output events emitted by CQL query for each partition.
-
Total Output Heartbeats: Number of heartbeat events emitted by CQL query for each partition. Please note that heartbeats are special events which ensures timestamp progression in Oracle Stream Analytics pipeline.
-
Throughput: Ratio of total number of events processed and total time spent in processing for each partition.
-
Latency: Average turnaround time taken to process a partition of stream.
-
HA Statistics: This table shows the real-time statistics about query's HA operations. Note that unit of time is in MILLISECONDS.
-
Partition ID: Partition Sequence ID
-
CQL Engine ID: Sequence ID of CQL Engine on which the partition is being processed.
-
Total Full Snapshots Created: Total number of times the full state of query is serialized and saved.
-
Avg Full Snapshot Creation Time: Average time spent in serializing and saving the full state of query.
-
Total Full Snapshots Loaded: Total number of times the full state of query is de-serialized and loaded in query plan.
-
Avg Full Snapshot Load Time: Average time spent in de-serializing and loading the full state of query.
-
Total Journal Snapshots Created: Total number of times the journaled state of query is serialized and saved.
-
Avg Journal Snapshot Creation Time: Average time spent in serializing and saving the journaled state of query.
-
Total Journal Snapshots Loaded: Total number of times the journaled state of query is de-serialized and loaded in query plan.
-
Avg Journal Snapshot Load Time: Average time spent in de-serializing and loading the journaled state of query.
Full Snapshot is the complete state of query. The query state represent the internal data structure and state of each operator in query plan. Journal snapshot is partial and incremental snapshot having a start time and end time. Oracle Stream Analytics optimizes the state preservation by using Journal snapshot if possible.
-
-