Viewing the First Record

The steps in this section explain how to set up the Logdump environment and start viewing records.

Running Logdump

Run the logdump program from the Oracle GoldenGate installation location. Logdump command lines are numbered so that you can use edit and history commands.

Setting Up the View

The following commands set up a Logdump environment that shows the information most commonly used when analyzing Oracle GoldenGate trail records.

  1. To view the record header with the data:
    Logdump 1> GHDR ON
    

    The record header contains information about the transaction.

  2. To add column information:
    Logdump 2> DETAIL ON
    

    Column information includes the number and length in hex and ASCII.

  3. To add hex and ASCII data values to the column information:
    Logdump 3> DETAIL DATA
    
  4. To view user tokens:
    Logdump 4> USERTOKEN ON
    

    User tokens are custom user-defined information that is specified in a TABLE or FILE mapping statement and stored in the trail file for specific purposes.

  5. To view automatically generated tokens:
    Logdump 4> GGSTOKEN ON
    

    Oracle GoldenGate automatically generated tokes include the transaction ID (XID), the row id for DML operations, the fetching status (if applicable), and tag value.

  6. To control how much record data is displayed:
    Logdump 5> RECLEN length
    

Opening a Trail File

To open a trail file, complete the following steps:

  1. Open a file with the following command:
    Logdump 6> OPEN file_name
    

    Where:

    file_name is either the relative name or fully qualified name of the file, including the file sequence number. For example:

    open /home/ggs/dirdat/jd000000
    open $data01.glogggl.aa000000
    
  2. To go to the first record and then move through records in sequence:
    Logdump 7> NEXT
    

    Alternatively, you can simply enter N.

Figure 1-1 Logdump Record as Seen on a Windows System
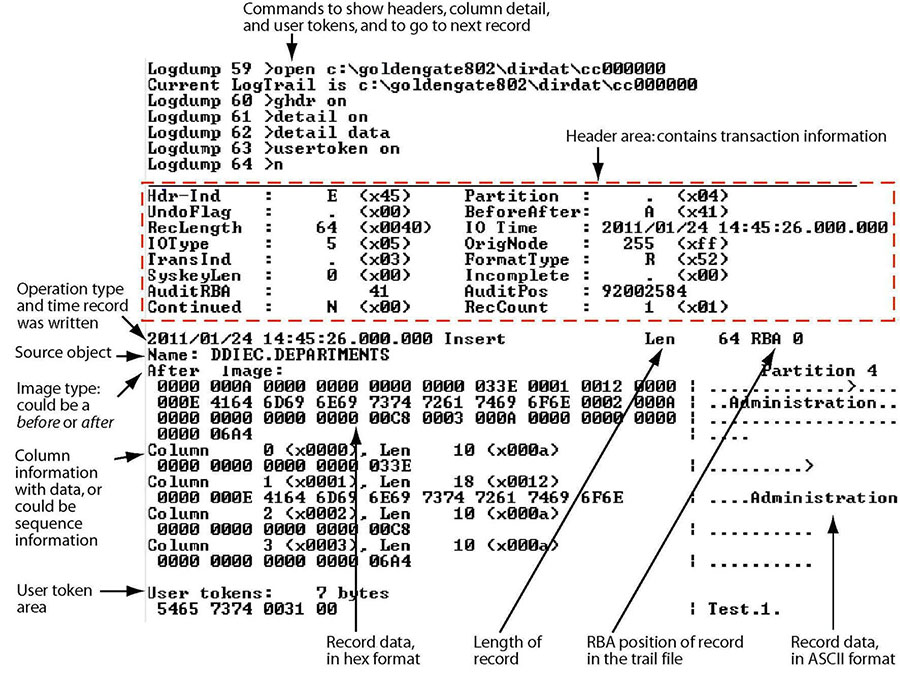
Description of Figure 1-1 follows
Description of "Figure 1-1 Logdump Record as Seen on a Windows System"

Figure 1-2 Trail Record as Seen on NonStop
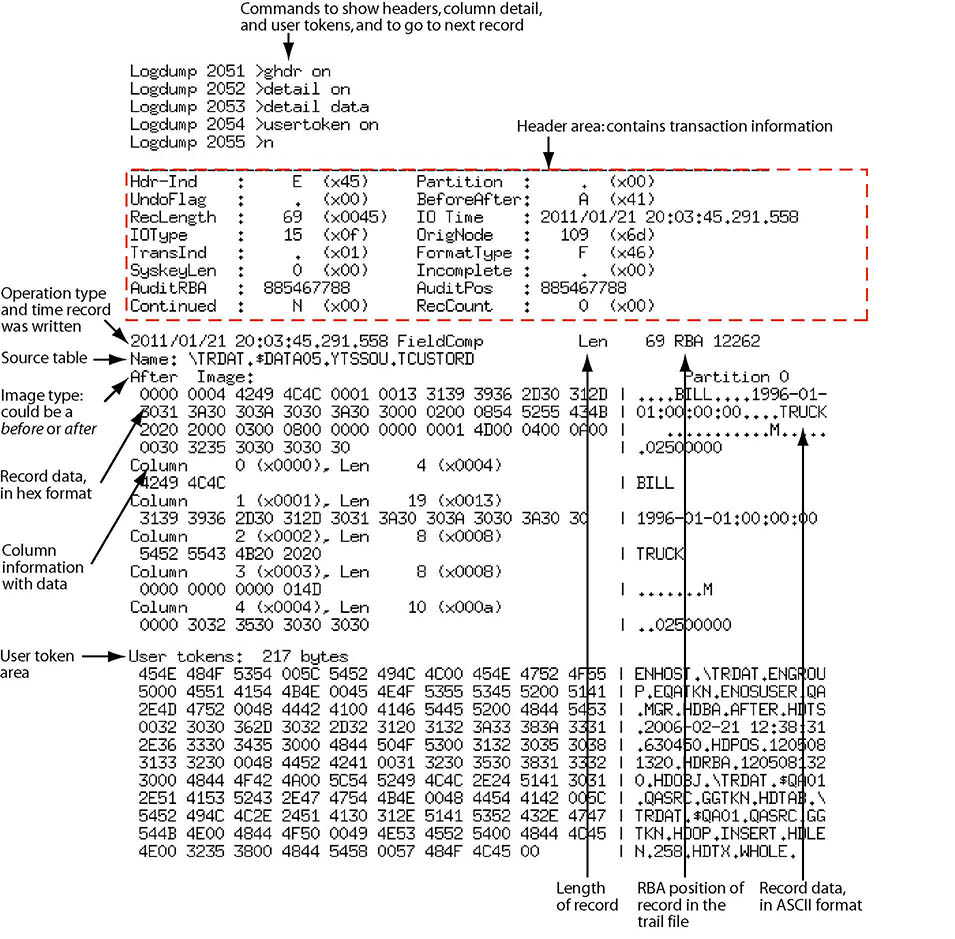
Description of Figure 1-2 follows
Description of "Figure 1-2 Trail Record as Seen on NonStop"