9 Working with Reports

This chapter describes the reporting features of Oracle SOA Suite for healthcare integration. The configurable reports display the real-time status of message processing through the healthcare integration application based on the criteria you specify.

This chapter includes the following topics:

9.1 Introduction to Reports

The Reports page of the Oracle SOA Suite for healthcare integration user interface lets you view the status of the messages being processing through Oracle Healthcare components in real-time. You can view all messages, or you can narrow down the messages displayed by a variety of criteria, including endpoints, date ranges, document information, and payload fields.

Several reports are predefined on the Oracle Healthcare user interface. These are Wire Message report, Unassociated Wire Message report, Business Message report, Application Message report, and Unassociated Application Message report. You can create additional reports based on more specific criteria to narrow down the types of messages displayed.

Each report is divided into four sections:

  • A report configuration bar

  • The message list

  • A graphical depiction of the message flow

  • Message details for the selected message

If you select multiple messages from the report, a summary of information for the selected messages appears in place of the flow diagram.

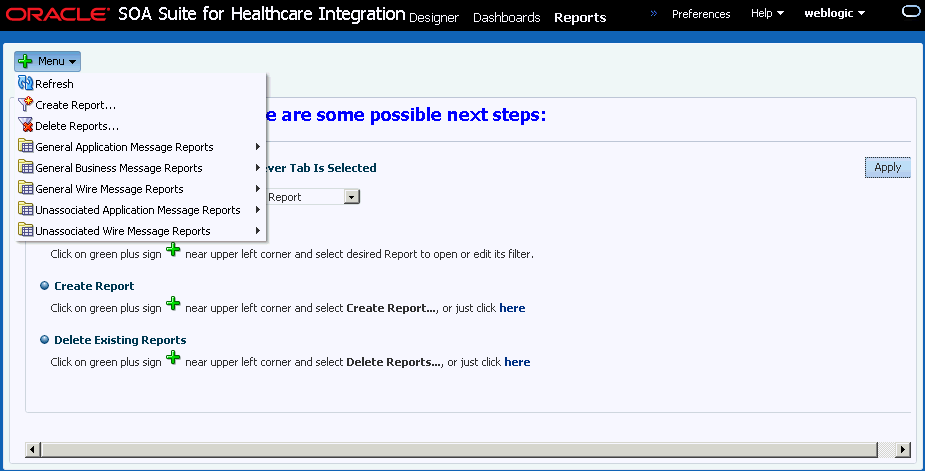
Oracle Healthcare provides a set of predefined reports based on the following report types that you can access by clicking the plus button on the top right corner of the Reports home page:

  • General Business Message reports: Lists all the Business Messages that have been exchanged from the beginning or in a give time range. You can customize these reports by using the Message Report Filter Customizer.

  • General Application Message reports: Lists all the Application Messages that have been exchanged. You can customize the report by using the Message Report Filter Customizer.

  • General Wire Message reports: Lists all the Wire Messages that have been exchanged. You can customize the report by using the Message Report Filter Customizer.

  • Unassociated Application Message reports: Lists all the Application Message reports that display Application Messages without any associated Business Messages. You can customize these reports by using the Message Report Filter Customizer.

  • Unassociated Wire Message reports: Lists all the Wire Message reports that display Wire Messages without any associated Business Messages. You can customize these reports by using the Message Report Filter Customizer.

See Working with Reports for Unassociated Messages for more information on Unassociated Message reports.

The customized reports are displayed in the Oracle Healthcare console under their respective report types as shown in Figure 9-1.

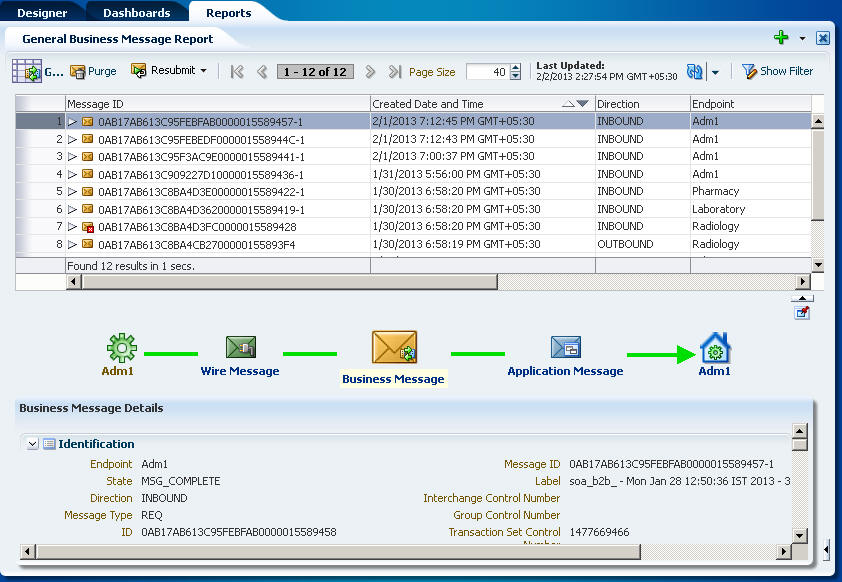
Figure 9-2 shows an example of a General Business Message report as displayed in the Reports tab.

Figure 9-2 Reports Page Showing a Predefined Business Message Report
Description of Figure 9-2 follows
Description of "Figure 9-2 Reports Page Showing a Predefined Business Message Report"

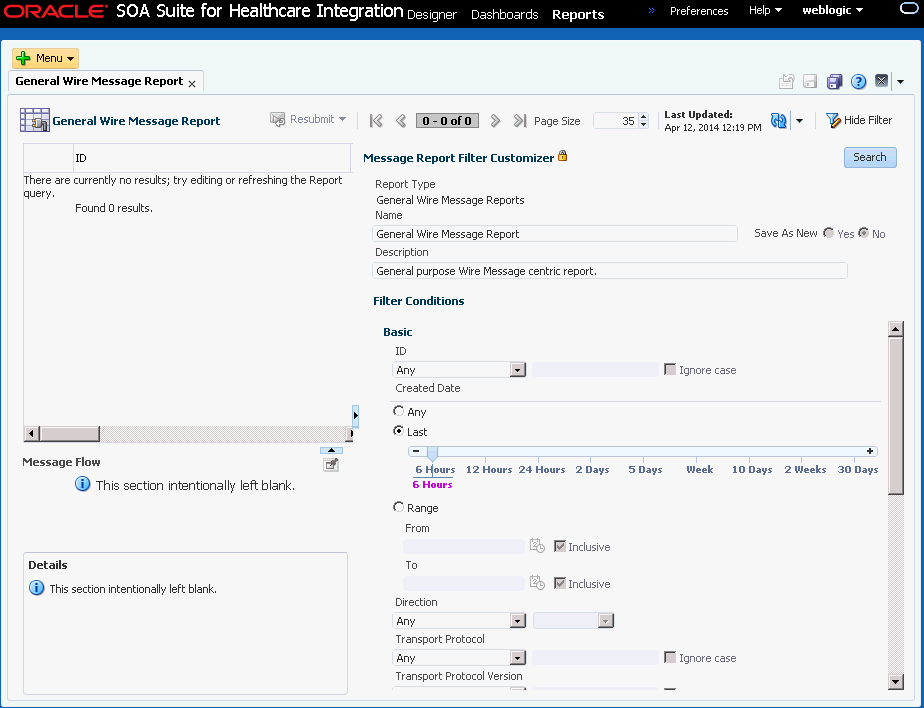
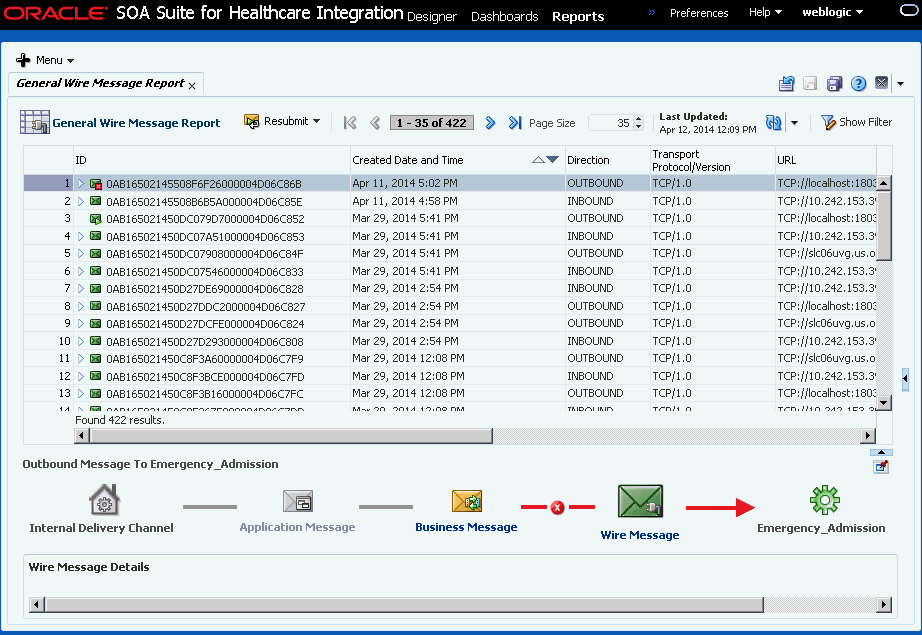
Figure 9-3 shows an example of a General Wire Message report as displayed in the Reports tab.

Figure 9-3 Reports Page Showing a Predefined Wire Message Report
Description of Figure 9-3 follows
Description of "Figure 9-3 Reports Page Showing a Predefined Wire Message Report"

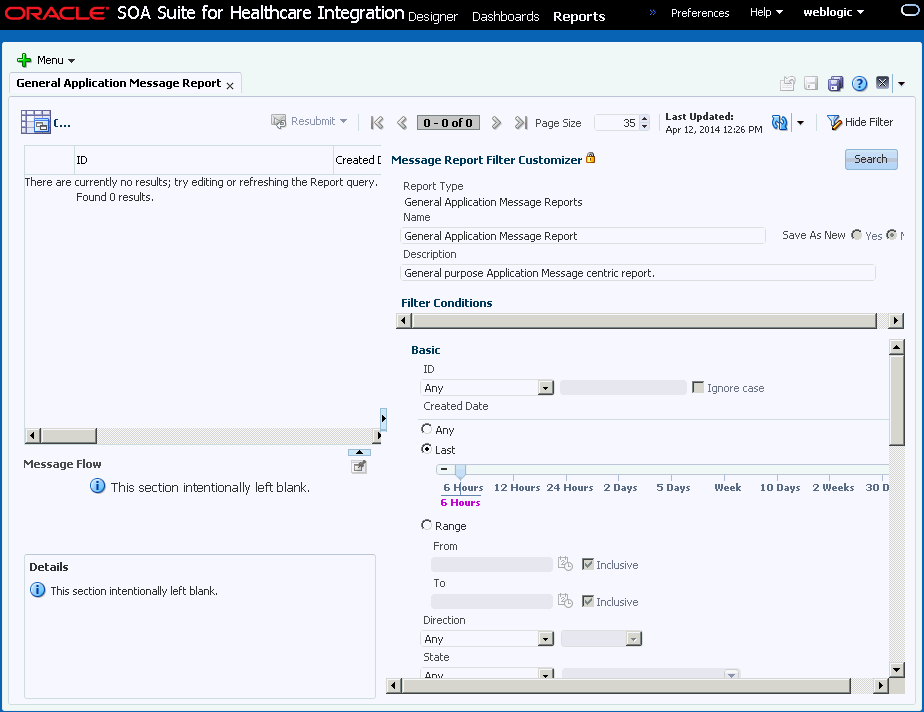
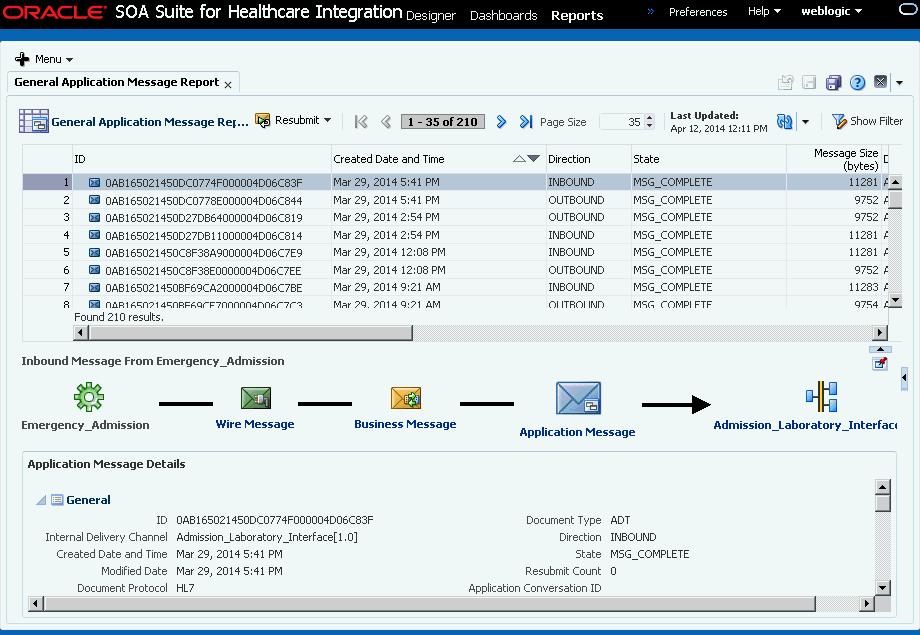
Figure 9-4 shows an example of a General Application Message report as displayed in the Reports tab.

Figure 9-4 Reports Page Showing a Predefined Application Message Report
Description of Figure 9-4 follows
Description of "Figure 9-4 Reports Page Showing a Predefined Application Message Report"

In the message list, each message is marked with a button that provides processing information about the message. An envelope button indicates normal processing; a green arrowhead over the envelope indicates the message was resubmitted; and a red square with an "X" over the envelope indicates an error.

9.1.1 About the Message Report Filter Customizers

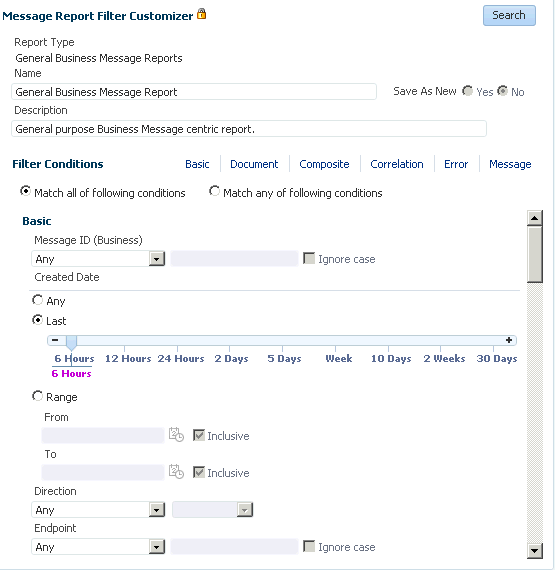
You use the three Message Report Filter Editors (Wire, Business, and Application) to create reports and to edit existing reports. The report editors allow you to define a wide variety of criteria for the messages that are displayed in the report, including a time range, endpoint, protocol, state, message status, and document definition information. You can also use advanced options, which include correlation fields, SOA composite fields, message IDs, and so on.

Figure 9-5 displays a sample Business Message Report Customizer.

Figure 9-5 Business Message Report Filter Customizer
Description of Figure 9-5 follows
Description of "Figure 9-5 Business Message Report Filter Customizer"

For most filters, you must select an operator that specifies how to evaluate the value you specify for the filter. You can also specify whether or not the search is case-sensitive. Most filters support the following operators to act against the value you specify: Any, Equals, Like, Not Equal, Among, or Not like. For the Among operator, you specify a list of up to 100 values, separated by commas, and messages that match one of the values in the list will be filtered. For the Like and Not Like operators, you can use SQL wildcard characters in the value. SQL wildcard characters include:

  • % (percent): Represents zero or more unknown characters

  • _ (underscore): Represents a single character

  • [charlist]: A list of characters; the unknown value is any character in the list

  • [^charlist] or [!charlist]: A list of characters; the unknown value is not a character in the list

For most string-based criteria, you can specify whether or not the search should be case sensitive by selecting or deselecting Ignore case next to the field. Use the links next to Filter Conditions to move between sections in the filter conditions list.

9.1.2 About Resubmitting Messages

When messaging errors are internal to Oracle SOA Suite for healthcare integration, you can correct the problem and resend the message. For example, if a message is sent to an endpoint that is not configured correctly, correct the error and use the resubmit feature for application messages or wire messages.

When messaging errors are because of endpoint Hostname/IPAddress or port change, then the messages are in MSG_WAIT_STACK or MSG_WAIT_TRANSMIT. Correct the Hostname/IPAddress or port of the endpoint and resubmit the first errored message which is in MSG_WAIT_STACK. All the pending messages in the sequence then use the updated Hostname/IPAddress or port of the endpoint and are processed. There is no need to resubmit every error message for the endpoint.

Resubmitting an application message for an outbound message clones the message, assigns the new message a status of RESUBMITTED, and attempts to deliver the clone. In addition, the RESUBMIT_COUNT of the original application message is incremented by 1. The RESUBMIT_REF_TO of the cloned message is set to the ID of the original application message as well. If the resubmitted application message is part of the batch message, the state of the associated wire message is set to RESUBMITTED as well. Resubmitting this type of message is helpful when the document configuration is not as per requirement and the message must be restructured with updated settings.

Resubmitting an application message for an inbound message sets the status of the message to RESUBMITTED and attempts to deliver the message again to the back-end application. Resubmitting this type of message is useful when the back-end application is down and the delivery must be retried.

Resubmitting a wire message for an outbound message sets the status of the message to RESUBMITTED and attempts to redeliver only the previously processed message. There is no repackaging or other message transformation. This is helpful when the problem was with the delivery endpoint (for example, the receiver's server is down and unable to receive the message).

Resubmitting a wire message for an inbound message clones the wire message, assigns the new message a status of RESUBMITTED, and attempts to deliver the message. In addition, the RESUBMIT_COUNT of the original wire message is incremented by 1. The RESUBMIT_REF_TO of the cloned message is set to the ID of the original wire message as well. The message statuses of the business and application messages are also set to RESUBMITTED. The functional acknowledgment is not returned to the remote endpoint even though the endpoint expects it. This is useful when the document settings are not correct and the message must be translated and validated again.

9.1.3 Important Note About Clustered Environments

In a clustered environment, if system time stamps are not synchronized for all nodes in the cluster, you might see message time stamps that look incorrect, but are not. For example, given an unsynchronized, multi-node cluster, if an outbound message is received on one node, but the reply is sent from another node, it is possible for a report to show message receipt at 4 a.m., but an acknowledgment sent at 3:55 a.m.

9.2 Creating and Configuring Reports

Oracle SOA Suite for healthcare integration provides several predefined reports for you to get started with. These reports are filtered only by a time range that you can configure under Designer > Administration > Settings > UI > Reports > Time Range.

See Configuring the User Interface Settings for more details. You can create additional reports that further filter messages by criteria such as endpoint, message ID, document properties, composite properties, transport protocol properties, and key payload fields. You can also use the predefined reports as a basis, and either modify them or save them as new reports.

9.2.1 Creating Business Message Reports

Although you have a predefined Business Message report, you can create additional reports to meet your specific requirements.

To create a Business Message report

  1. On the Oracle SOA Suite for healthcare integration user interface, click the Reports tab.

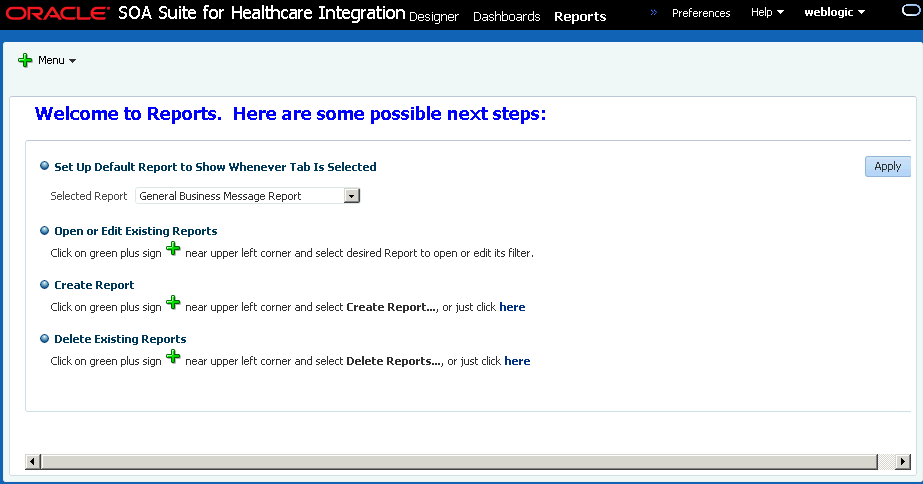
    The Reports Welcome page appears when there are no opened reports.

    Figure 9-6 Reports Welcome Page

    Description of Figure 9-6 follows
    Description of "Figure 9-6 Reports Welcome Page"
  2. Click the plus button in the upper right, and select Create Report.
  3. On the Create Message Report dialog, enter a name for the report, select General Business Message Reports from the Report Type list, and click Create as shown in Figure 9-7.

    The report appears with the Message Report Filter Customizer displayed.

  4. On the Message Report Filter Customizer, enter any of the filter criteria described in Table 9-1.

    Note:

    When a Wire/Business/Application Message Report is first created (or cloned by doing a Save As New), no search is automatically done when the report is first opened. You must explicitly click the Search button.

    Use the links next to Filter Conditions to quickly move between the different sections in the filter conditions list.

    Note:

    Multiple conditional operators are supported for most string criteria. For more information about using Any, Equals, Like, Among, Not Equal, or Not Like, see About the Message Report Filter Customizers.

    Table 9-1 Business Message Report Customizer Options

    Filter Description

    Name

    The name of the report.

    Description

    A brief description of the report.

    Match

    An indicator of whether the search criteria are joined by an AND or OR operator. Select Match all of the following conditions to use AND; select Match any of the following condition to use OR.

    Message ID (Business)

    The business message ID of the message to display. Select the operator and then enter an appropriate value for a message ID.

    Any

    Does not narrow the report by any date range, and displays messages from all dates and times.

    Last

    Narrows the report down to a range of most recent dates or times. For example, you can select the past 12 hours, past five days, or past two weeks. Slide the pointer on the sliding scale to select a time range. You can modify the Enabled Time Slider Periods under UI Settings.

    Range

    Narrows the report down to the range of dates you specify. In the From or To field, or in both fields, provide a date and time in the format shown (MM/DD/YYYY HH:MM:SS AM/PM) or click the Select Date and Time button to select a date and specify the time.

    To search for all messages after a specific date, only enter a date for the From field. To search for all messages earlier than a specific date, only enter a date in the To field. To search for all messages within a range of dates, enter dates in both the From and To fields. To exclude a specific time range, enter the first date in the range to exclude in the To field and enter the last date in the range to exclude in the From field. You must select the Match any of the following conditions indicator to use this excluded range. The search returns all messages received.

    For both the from and to dates, select Inclusive to include the specified dates in the search, or clear Exclusive to exclude those dates from the search.

    Direction

    The direction of the messages to display. Select from Any, Equals, or Not Equals, and then click in the field on the right to select a direction (inbound or outbound) from the list

    Endpoint

    The endpoint from where the messages are received or to which the messages are delivered. Select the operator and then enter the name of a defined endpoint.

    State

    The state of the messages to display. Select from Any, Equals, or Not Equals, and then click in the field on the right to select one or more message states from the list.

    Document

    The following three fields specify document properties. These three fields control what is shown in the Document Type column in the reports table. For any of these fields, select Ignore case if you do not want the search to be case sensitive.

    • Protocol

    The document protocol of the messages to display. Select the operator and then enter the document protocol. For HL7 messages, enter HL7.

    • Version

    The document protocol version of the messages to display. Select the operator and then enter the version. For example, for HL7 2.6 messages, enter 2.6.

    • Type

    The document protocol type of the messages to display. Select the operator and then enter the version. For example, for HL7 ADT_A04 messages, enter ADT_A04.

    Payload Key Fields

    Name and value pairs that narrow the search down by the contents of a field in a message. For each field name you enter, enter a corresponding value for the field. For any of the names or values, select the operator.

    These fields can only be used if they are defined on the XPath page for the document definition. For Name fields, enter the name specified on the XPath page, which represents a field in the message. For Value fields, enter the expected value of the corresponding field.

    When you create your document definitions, you can specify up to three fields in the message as payload key fields. These fields are defined by a unique name and an XPath expression that locates the field in the message. For example, you might name a field LastName and specify the XPath expression for the last name field in the PID segment of an HL7 A03 message. You can similarly define correlation fields for a document definition.

    If you have defined either correlation fields or payload key fields for a document definition, then you can use these fields as filters for business message reports. In the filter editor, these filters are defined by name and value pairs. You use the unique name you gave the field when you created the document definition, and then specify what the value should be for that field in the messages you want to include on the report.

    • Document Definition

    The document definition used by the messages to display. Select the operator and then enter the name of a defined document definition.

    • Interchange Control Number

    A unique identifier for the interchange. This number is used to track messages, to find duplicate or missing transmissions, or to find messages that are out of sequence.

    • Group Control Number

    A unique identifier for the group. This number is used for auditing, to find duplicate or missing groups, or to find groups that are out of sequence.This number is referenced by the functional acknowledgment.

    • Transaction Set Control Number

    A unique identifier for the transaction set. The functional acknowledgment references this number for transaction set acknowledgment.

    • Transport Protocol Name

    The name of the transport protocol used by the Oracle SOA composite application.

    • Transport Protocol Version

    The version of the transport protocol used by the Oracle SOA composite application

    • ECID

    The execution context ID. The ECID enables end-to-end message tracking.

    • Composite Instance ID

    The Oracle SOA composite instance ID.

    • Composite Name

    The name of the Oracle SOA composite application in Oracle JDeveloper.

    • Service Name

    The name of the healthcare integration service binding component in the Oracle SOA composite application.

    • Reference Name

    The name of the healthcare integration reference binding component in the Oracle SOA composite application.

    • Domain Name

    The name of the WebLogic domain on which the Oracle SOA composite application is deployed.

    • Composite Version

    The version of the Oracle SOA composite application in Oracle JDeveloper.

    • Correlation From XPath Name

    The name of the correlation field for initiating the correlation This and the remaining correlation fields can only be used if they are defined on the Correlation page for the document definition. For usage information, see Payload Key Fields in Table 9-1.

    • Correlation From XPath Value

    The value of the above field.

    • Correlation To XPath Name

    The name of the second field for the correlation.

    • Correlation To XPath Value

    The value of the above field.

    • Error Code

    The error code for error message to display on the report.

    • Error Text

    The text of an error message to display on the report.

    • Application Message ID

    The unique identifier for the application message to display in the report.

    • Protocol Message ID

    The unique protocol message identifier for messages displayed in the report.

    • Native Message Size

    The size of the original message prior to being translated. Select from Any, Equals, Not Equal, Less than, Less than or equals, Greater than, or Greater than or equals, and provide a numerical value.

    • Translated Message Size

    The size of the message after it is translated. Select from Any, Equals, Not Equal, Less than, Less than or equals, Greater than, or Greater than or equals, and provide a numerical value.

  5. To revert any unsaved changes you made to the report filters, click Revert.
  6. When you are done specifying report filters, do any of the following:
    • To test your filter criteria, click Search, and then click the Show/Hide Filter toggle button.

    • To save the changes you made to the filter criteria for the report, click Save.

      Note:

      You cannot save changes made to the standard reports (such as General Business Message Report). You can only click the Save As New button that is enabled only when the name of the report has been changed from its standard form.

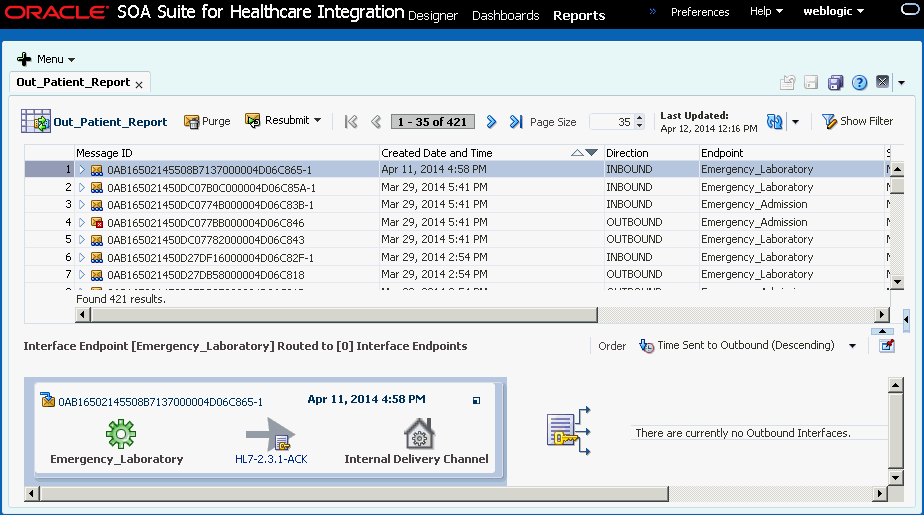
Figure 9-8 displays a custom Business Message Report, which lists all the Business Messages exchanged by Emergency_Admission and Emergency_Laboratory endpoints in the last 30 days.

Figure 9-8 A Custom Business Message Report
Description of Figure 9-8 follows
Description of "Figure 9-8 A Custom Business Message Report"

You can sort the messages based on any of the report columns by clicking the column headers.

9.2.2 Creating Wire Message Reports

Apart from the predefined Wire Message reports, you can create customized Wire Message reports that covers Wire Messages coming from and going to an external endpoint. Most Wire Messages have associated Business Messages, which is reflected in the Message Flow diagram in the report.

To create a Wire Message report

  1. Perform Steps 1 and 2 from Creating Business Message Reports.
  2. On the Create Message Report dialog, enter a name for the report, select General Wire Message Reports from the Report Type list, and click Create.

    The report appears with the Message Report Filter Customizer displayed as shown in Figure 9-9.

    Figure 9-9 Wire Message Report Filter Customizer

    Description of Figure 9-9 follows
    Description of "Figure 9-9 Wire Message Report Filter Customizer"
  3. On the Message Report Filter Customizer, enter any of the filter criteria described in Table 9-2.

    Note:

    Multiple conditional operators are supported for most string criteria. For more information about using Any, Equals, Like, Among, Not Equal, or Not Like, see About the Message Report Filter Customizers.

    Table 9-2 Wire Message Report Filter Customizer Options

    Filter Description

    Name

    The name of the report.

    Description

    A brief description of the report.

    ID

    The Wire Message ID of the message to display. Select the operator and then enter all or part of a message ID.

    Any

    Does not narrow the report by any date range, and displays messages from all dates and times.

    Last

    Narrows the report down to a range of most recent dates or times. For example, you can select the past 12 hours, past five days, or past two weeks. Slide the pointer on the sliding scale to select a time range.

    Range

    Narrows the report down to the range of dates you specify. In the From or To field, or in both fields, provide a date and time in the format shown (MM/DD/YYYY HH:MM:SS AM/PM) or click the Select Date and Time button to select a date and specify the time.

    To search for all messages after a specific date, only enter a date for the From field. To search for all messages earlier than a specific date, only enter a date in the To field. To search for all messages within a range of dates, enter dates in both the From and To fields. To exclude a specific time range, enter the first date in the range to exclude in the To field and enter the last date in the range to exclude in the From field. You must select the Match any of the following conditions indicator to use this excluded range. The search returns all messages received.

    For both the from and to dates, select Inclusive to include the specified dates in the search, or clear Exclusive to exclude those dates from the search.

    Direction

    The direction of the messages to display. Select from Any, Equals, or Not Equal, and then click in the field on the right to select a direction (inbound or outbound) from the list

    Transport Protocol

    The transport protocol of the messages to display. Select from Any, Equals, Like, Not equal, or Not like, and then enter the name of a defined transport protocol. Select Ignore case if you do not want the search to be case sensitive.

    Transport Protocol Version

    The transport protocol version of the messages to display. Select from Any, Equals, Like, Not equal, or Not like, and then enter the name of a defined transport protocol version. Select Ignore case if you do not want the search to be case sensitive.

    URL

    The TCP endpoint URL of the messages to display. Select from Any, Equals, Like, Not equal, or Not like, and then enter a defined URL value. Select Ignore case if you do not want the search to be case sensitive.

    State

    The state of the messages to display. Select from Any, Equals, Like, Not equal, or Not like, and then click in the field on the right to select one or more message states from the list.

    Message Size (bytes)

    The size of the messages (in bytes) to display. Select from Any, Equals, Not equal, Less than, Less than or equals, or Greater than, or Greater than or equals, and then enter a defined message size.

    Resubmit Count

    The number times a message (to be displayed) has been resubmitted. Select from Any, Equals, Not equal, Less than, Less than or equals, or Greater than, or Greater than or equals, and then enter a defined count.

    Last Resubmitted Date

    The date when a message (to be displayed) was last resubmitted. Select from the Any, Last, or Range options.

  4. To revert any unsaved changes you made to the report filters, click Revert.
  5. When you are done specifying report filters, do any of the following:
    • To test your filter criteria, click Search, and then click the Show/Hide Filter toggle button.

    • To save the changes you made to the filter criteria for the report, click Save As New.

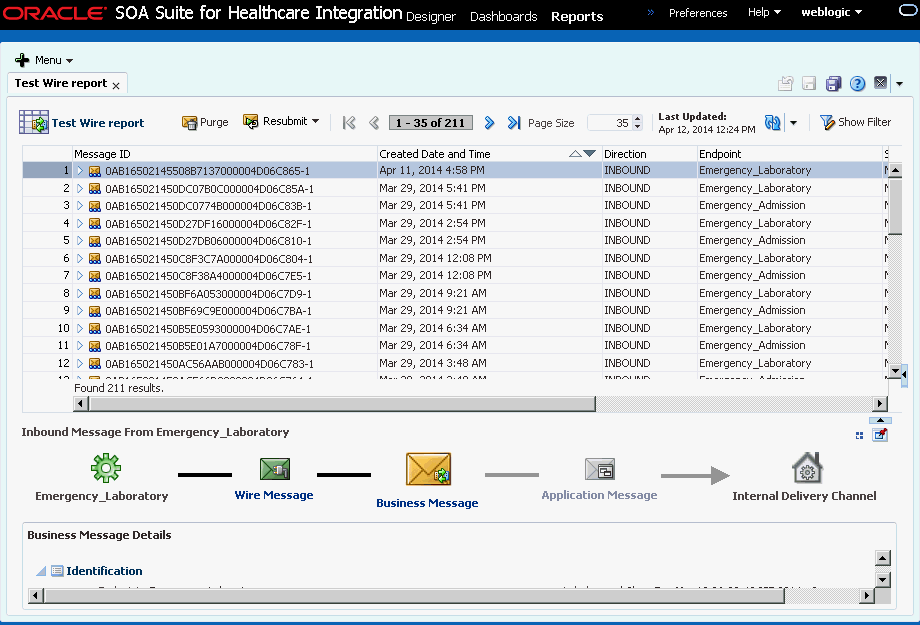
Figure 9-10 displays a custom Wire Message Report, which lists all the inbound Wire Messages in the last 30 days.

Figure 9-10 A Custom Wire Message Report

Description of Figure 9-10 follows
Description of "Figure 9-10 A Custom Wire Message Report"

You can sort the messages based on any of the report columns by clicking the column headers.

9.2.3 Creating Application Message Reports

Apart from the predefined Application Message reports, you can create customized Application Message reports that covers Application Message going to or coming from the Fabric/Composite layer. Most Application Messages coming into Oracle Healthcare runtime result in corresponding Business Messages, which is reflected in the Message Flow diagram in the report.

To create a Wire Message report

  1. Perform Steps 1 and 2 from Creating Business Message Reports.
  2. On the Create Message Report dialog, enter a name for the report, select General Application Message Reports from the Report Type list, and click Create.

    The report appears with the Message Report Filter Customizer displayed as shown in Figure 9-11.

    Figure 9-11 Application Message Report Filter Customizer

    Description of Figure 9-11 follows
    Description of "Figure 9-11 Application Message Report Filter Customizer"
  3. On the Message Report Filter Customizer, enter any of the filter criteria described in Table 9-3.

    Note:

    Multiple conditional operators are supported for most string criteria. For more information about using Any, Equals, Like, Among, Not Equal, or Not Like, see About the Message Report Filter Customizers.

    Table 9-3 Application Message Report Filter Customizer Options

    Filter Description

    Name

    The name of the report.

    Description

    A brief description of the report.

    ID

    The Application Message ID of the message to display. Select the operator and then enter all or part of a message ID.

    Any

    Does not narrow the report by any date range, and displays messages from all dates and times.

    Last

    Narrows the report down to a range of most recent dates or times. For example, you can select the past 12 hours, past five days, or past two weeks. Slide the pointer on the sliding scale to select a time range.

    Range

    Narrows the report down to the range of dates you specify. In the From or To field, or in both fields, provide a date and time in the format shown (MM/DD/YYYY HH:MM:SS AM/PM) or click the Select Date and Time button to select a date and specify the time.

    To search for all messages after a specific date, only enter a date for the From field. To search for all messages earlier than a specific date, only enter a date in the To field. To search for all messages within a range of dates, enter dates in both the From and To fields. To exclude a specific time range, enter the first date in the range to exclude in the To field and enter the last date in the range to exclude in the From field. You must select the Match any of the following conditions indicator to use this excluded range. The search returns all messages received.

    For both the from and to dates, select Inclusive to include the specified dates in the search, or clear Exclusive to exclude those dates from the search.

    Direction

    The direction of the messages to display. Select from Any, Equals, or Not Equal, and then click in the field on the right to select a direction (inbound or outbound) from the list

    State

    The state of the messages to display. Select from Any, Equals, Like, Not equal, or Not like, and then click in the field on the right to select one or more message states from the list.

    Message Size (bytes)

    The size of the messages (in bytes) to display. Select from Any, Equals, Not equal, Less than, Less than or equals, or Greater than, or Greater than or equals, and then enter a defined message size.

    • Protocol

    The document protocol of the messages to display. Select the operator and then enter the document protocol. For HL7 messages, enter HL7.

    • Version

    The document protocol version of the messages to display. Select the operator and then enter the version. For example, for HL7 2.6 messages, enter 2.6.

    • Type

    The document protocol type of the messages to display. Select the operator and then enter the version. For example, for HL7 ADT_A04 messages, enter ADT_A04.

    • Document Definition

    The document definition used by the messages to display. Select the operator and then enter the name of a defined document definition.

    • ECID

    The execution context ID. The ECID enables end-to-end message tracking.

    • Domain Name

    The name of the WebLogic domain on which the Oracle SOA composite application is deployed.

    • Composite Name

    The name of the Oracle SOA composite application in Oracle JDeveloper.

    • Composite Version

    The version of the Oracle SOA composite application in Oracle JDeveloper.

    • Composite Instance ID

    The Oracle SOA composite instance ID.

    • Service Name

    The name of the healthcare integration service binding component in the Oracle SOA composite application.

    • Reference Name

    The name of the Oracle Healthcare reference binding component in the Oracle SOA composite application.

    Resubmit Count

    The number times a message (to be displayed) has been resubmitted. Select from Any, Equals, Not equal, Less than, Less than or equals, or Greater than, or Greater than or equals, and then enter a defined count.

    Last Resubmitted Date

    The date when a message (to be displayed) was last resubmitted. Select from the Any, Last, or Range options.

  4. To revert any unsaved changes you made to the report filters, click Revert.
  5. When you are done specifying report filters, do any of the following:
    • To test your filter criteria, click Search, and then click the Show/Hide Filter toggle button.

    • To save the changes you made to the filter criteria for the report, click Save AS New.

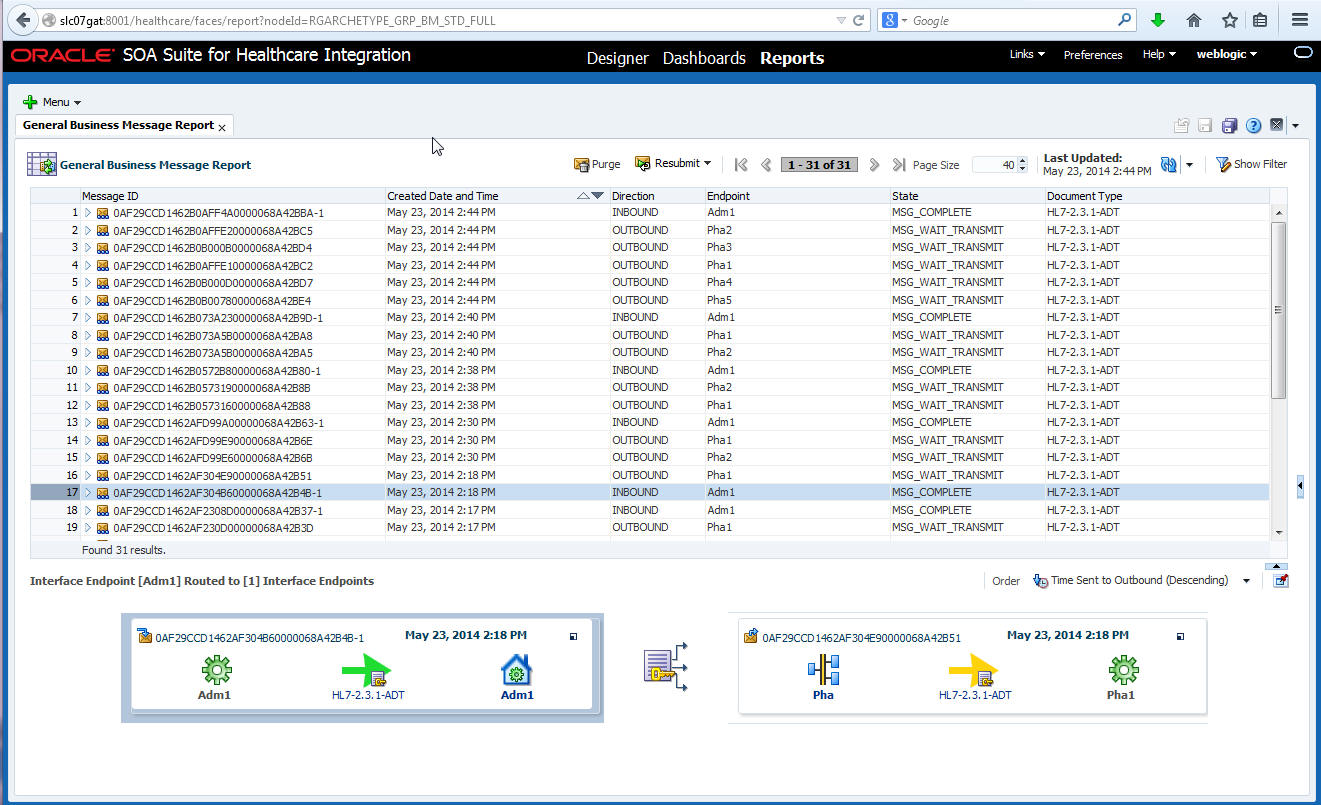
Figure 9-12 displays a custom Application Message Report, which lists all the Application Messages exchanged in the last 30 days having state as Complete.

Figure 9-12 A Custom Application Message Report
Description of Figure 9-12 follows
Description of "Figure 9-12 A Custom Application Message Report"

You can sort the messages based on any of the report columns by clicking the column headers.

9.2.4 Specifying a Default Report

You can select one report that automatically appears when you click the Reports tab. This is the default report.

To specify a default report

  1. On the Oracle SOA Suite for healthcare integration user interface, click the Reports tab. The Reports Welcome page appears when there are no opened reports.
  2. Click the down arrow next to the Selected Report field, and select the report that you want to make default.
  3. Click Apply.

    The selected report appears. The next time you select the Reports tab, this report automatically appears.

9.2.5 Configuring Reports

After you create a report, you can use the Message Report Filter Customizer to modify the filter criteria for the report. You can also create a report using an existing report as a template.

To configure a report

  1. With the report you want to configure displayed on the Reports tab, click Show Filter.

    The Message Report Filter Customizer appears.

    Figure 9-13 Message Report Filter Customizer

    Description of Figure 9-13 follows
    Description of "Figure 9-13 Message Report Filter Customizer"
  2. Modify any of the filters described in Table 9-1, Table 9-2, or Table 9-3 based on the report type.
  3. To revert any unsaved changes you made to the report filters, click Revert.
  4. When you are done specifying report filters, do any of the following:
    • To test your filter criteria, click Search, and then click the Show/Hide Filter toggle button.

    • To save the changes you made to the filter criteria for the report, click Save As New.

9.2.6 Refreshing a Report and Setting the Auto-Refresh Rate

You can manually refresh the displayed report at any time, but you can also specify that the report be automatically updated at set intervals. Note that the auto-refresh rate is only activated and configured for the current session. If you close and then re-open a report, the auto-refresh option is disabled.

To refresh a reports and set the auto-refresh rate

  1. If the report you want to monitor is not already displayed, click the plus button in the upper right of the main Reports page and select the report to configure.

  2. To refresh the report, click the Refresh button in the upper right.

  3. To enable the auto-refresh option, do the following:

    1. Click the down arrow to the right of the Refresh button in the report toolbar.

    2. Specify the time interval in seconds to wait between automatically refreshing the report, and then select the Auto-Refresh check box.

    3. To disable automatic refreshing, clear the Auto-Refresh check box.

9.2.7 Deleting Reports

You can delete any of the user-created reports if you have the Administrator role. You can also delete any of the predefined reports, but use caution when doing this because this action is irreversible.

To delete a report

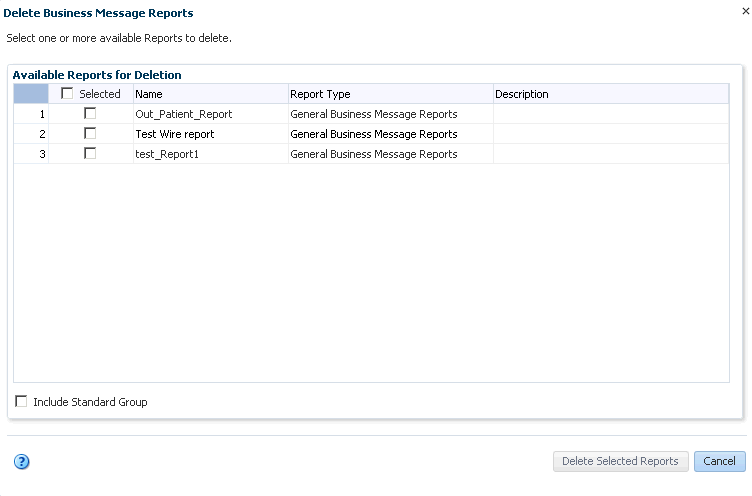
  1. From the main Reports page, click the plus button in the upper right and select Delete Reports.

    The Delete Business Message Reports dialog appears.

    Figure 9-14 Delete Business Message Reports Dialog

    Description of Figure 9-14 follows
    Description of "Figure 9-14 Delete Business Message Reports Dialog"
  2. By default, only the user-created reports appear in the list. To include predefined reports, select Include Standard Group. This only pertains to standard reports imported from previous versions of the Oracle Healthcare console such as All, Last 24 Hours, Last 2 Weeks, and so on.
  3. In the reports list, select the check box next to the reports you want to delete.
  4. Click Delete Selected Reports or click Cancel to close the dialog box without deleting any reports.

9.3 Viewing Reports and Report Information

When you first open a report, a list of messages matching the report criteria appears on the Reports tab. This list shows summary information for each message.

The summary information includes the following:

  • Message ID

  • Created Date and Time

  • Direction

  • Endpoint

  • State

  • Document Type

You can select any of the messages in the list to view more detailed information and you can view a summary of multiple messages, as described in the following:

If you do not have permissions to view the document type of a message, certain details are hidden from view. The option to download information is disabled unless you have the required permissions.

9.3.1 Viewing a Business Message Instance

Business Messages include instance information for a document protocol, including the endpoint name, the message direction, the message ID, the state, the transport protocol and document protocol, and message details.

To view a business message instance

  1. Display a report on the Reports page.
  2. In the messages list, select the message for which you want to view instance data, then click the button highlighted in red in Figure 9-15 to navigate through the details of the business message. Refer to End-to-End Monitoring of Runtime Data for more information about the higher level reporting format.

    Figure 9-15 Expand Details of the Business Message

    Description of Figure 9-15 follows
    Description of "Figure 9-15 Expand Details of the Business Message"

    The message flow diagram appears below the message list as shown in Figure 9-16.

    Figure 9-16 Business Message Flow

    Description of Figure 9-16 follows
    Description of "Figure 9-16 Business Message Flow"
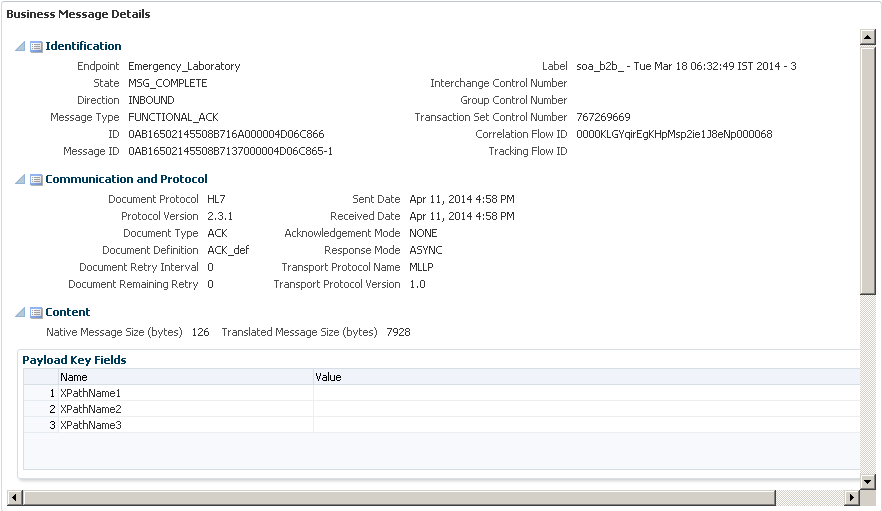
  3. To view the message details in a larger area, click Business Message in the message flow diagram and then click the Collapse Pane button beneath the message list. You can also click Pin Current Message Details Into a New Tab to open a new page containing the detailed information.

    The message details appear as shown in Figure 9-17.

    Figure 9-17 Business Message Details

    Description of Figure 9-17 follows
    Description of "Figure 9-17 Business Message Details"
  4. Expand or collapse sections of the business message by clicking the arrow button next to the section you want to expand or collapse.
  5. To download information, click Download As XML or Download as Text in the section you want to download.

    Note:

    This option is not available in all sections.

  6. If you collapsed the message list pane, click Restore Pane above the message flow diagram to return to the message list.

9.3.2 Viewing a Wire Message

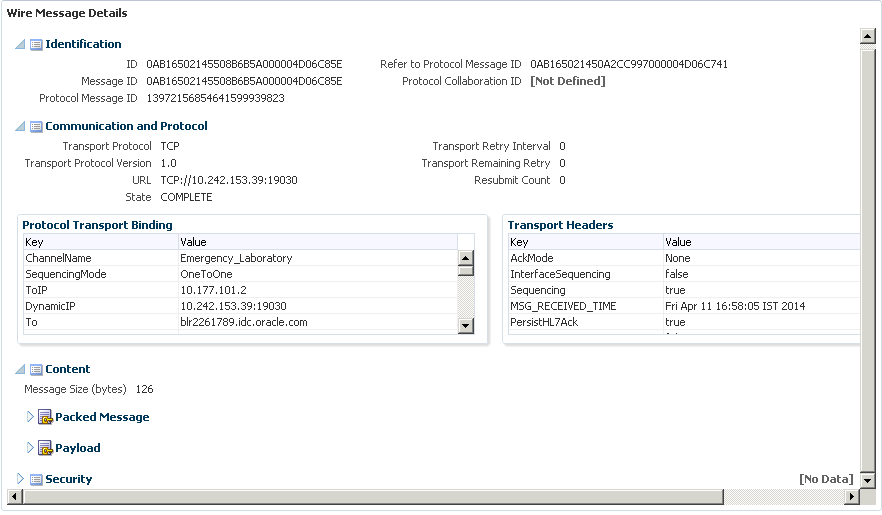
Wire messages are the native format of data sent into or out from an endpoint. Wire message details include message IDs, communication and protocol information (such as the transport binding and header details), payload message content, packed message content, and security information.

To view a wire message

  1. Display a report on the Reports page.
  2. In the messages list, select the message for which you want to view instance data.

    The message flow diagram appears below the message list as shown in Figure 9-18.

  3. To view the message details in a larger area, click Wire Message in the message flow diagram and then click the Collapse Pane button beneath the message list. You can also click Pin Current Message Details Into a New Tab to open a new page containing the detailed information.

    The message details appear as shown in Figure 9-19.

    Figure 9-19 Wire Message Details

    Description of Figure 9-19 follows
    Description of "Figure 9-19 Wire Message Details"
  4. Expand or collapse sections of the Wire Message by clicking the arrow button next to the section you want to expand or collapse.
  5. To download information, click Download As XML or Download as Text in the section you want to download.

    Note:

    This option is not available in all sections.

  6. If you collapsed the message list pane, click Restore Pane above the message flow diagram to return to the message list.

9.3.3 Viewing an Application Message

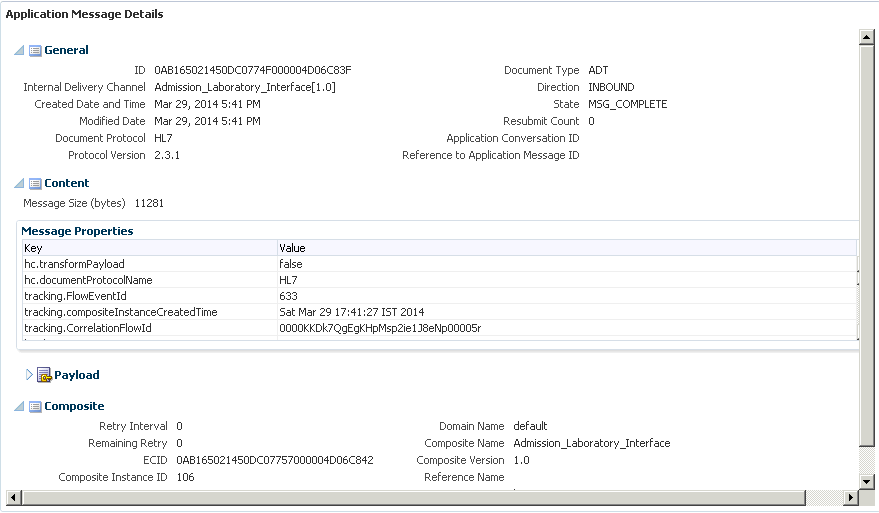
Application messages provide information related to the SOA composite if a back-end composite application sent or received the message, including the composite name, version, instance ID, and so on.

To view an application message

  1. Display a report on the Reports page.
  2. In the messages list, select the message for which you want to view instance data.

    The message flow diagram appears below the message list as shown in Figure 9-20.

    Figure 9-20 Application Message Flow

    Description of Figure 9-20 follows
    Description of "Figure 9-20 Application Message Flow"
  3. To view the message details in a larger area, click Application Message in the message flow diagram and then click the Collapse Pane button beneath the message list. You can also click Pin Current Message Details Into a New Tab to open a new page containing the detailed information.

    The message details appear as shown in Figure 9-21.

    Figure 9-21 Application Message Details

    Description of Figure 9-21 follows
    Description of "Figure 9-21 Application Message Details"
  4. Expand or collapse sections of the application message by clicking the arrow button next to the section you want to expand or collapse.
  5. To download information, click Download As XML or Download as Text in the section you want to download.

    Note:

    This option is not available in all sections.

  6. If you collapsed the message list pane, click Restore Pane above the message flow diagram to return to the message list.

9.3.4 Viewing the Flow Trace in Oracle Enterprise Manager

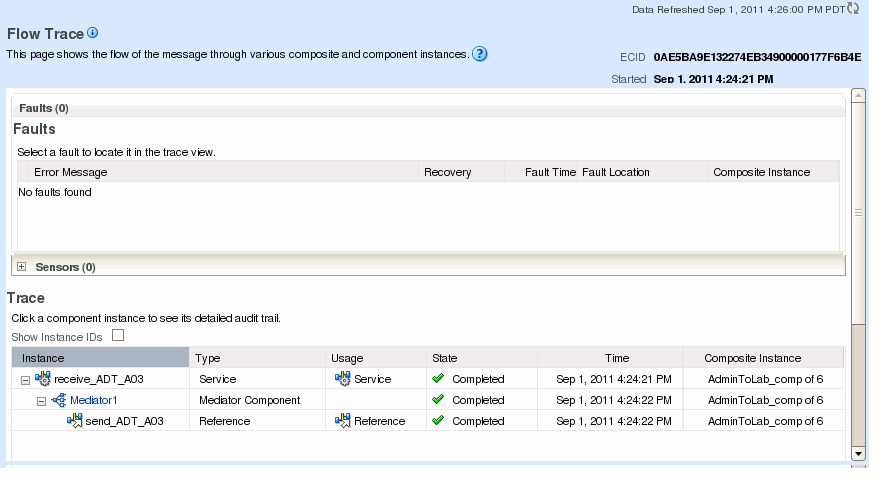
Oracle Healthcare reports provide links for each message to the flow trace of the composite in Oracle Enterprise Manager. Clicking the link automatically opens Oracle Enterprise Manager to the correct Flow Trace page.

To view the flow trace in Oracle Enterprise Manager

  1. Display a report on the Reports page.
  2. In the messages list, select the message for which you want to view the flow trace.

    The message flow diagram appears below the message list.

    Figure 9-22 Oracle Healthcare Message Flow

    Description of Figure 9-22 follows
    Description of "Figure 9-22 Oracle Healthcare Message Flow"
  3. Click the composite link in the message flow diagram.

    The Login page of Oracle Enterprise Manager opens in a separate browser tab or window.

  4. Enter your login information for Oracle Enterprise Manager and then click Login.

    The flow trace appears for the selected message as shown in Figure 9-23.

    Figure 9-23 Message Flow Trace in Oracle Enterprise Manager

    Description of Figure 9-23 follows
    Description of "Figure 9-23 Message Flow Trace in Oracle Enterprise Manager"

9.3.5 Viewing Overview Information for Multiple Messages

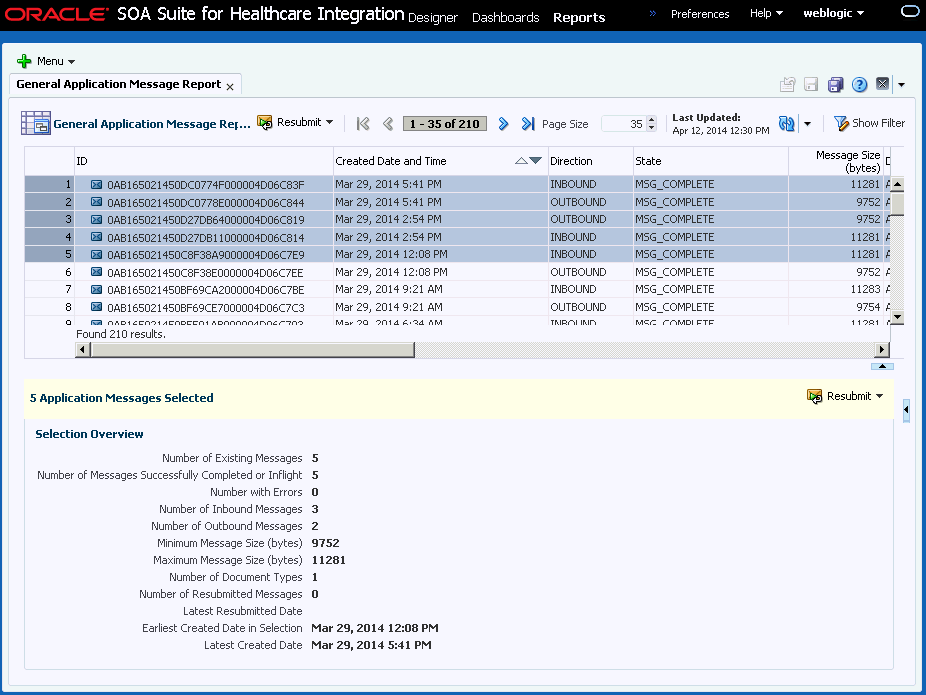
You can view a summary of information for multiple selected messages in the messages list of a report. This gives you a quick view of all selected messages, including the number of messages processed, the number of endpoints and document types used, the number of errors, the number of processed messages, and so on.

To see an overview of multiple messages

  1. Display a report on the Reports page.
  2. In the messages list, select the messages for which you want to view summary data by clicking the first message that you want to delete, press Shift, and then click the last message of the desired range.

    An overview of the selected messages appears beneath the list as shown in Figure 9-24.

    Figure 9-24 Multiple Messages Selected for a Report

    Description of Figure 9-24 follows
    Description of "Figure 9-24 Multiple Messages Selected for a Report"
  3. From here you can purge or resubmit the selected messages.

9.4 Working with Reports for Unassociated Messages

If a wire message or an application message does not have any associated business message, they are categorized as unassociated messages.

Unassociated messages can be viewed in Unassociated Wire Message reports and Unassociated Application Message reports.

9.4.1 Working with Unassociated Wire Messages

A burst of incoming messages from an external endpoint results in over-burdening the Oracle Healthcare runtime processing capability. These messages then gets temporarily backlogged and marked as PROCESSING. As a result of which, these Wire Messages do not have any associated Business Messages. Immediate ACKs generated by an inbound HL7 MLLP endpoint also results in Wire Messages without any associated Business Messages.

9.4.1.1 Creating Unassociated Wire Message Reports

You can create an Unassociated Wire Message report in a way similar to creating General Wire Message reports.

To create an unassociated wire message report

  1. Perform Steps 1 and 2 from Creating Business Message Reports.
  2. On the Create Message Report dialog, enter a name for the report, select Unassociated Wire Message Reports from the Report Type list, and click Create.

    The report appears with the Message Report Filter Customizer displayed.

  3. On the Message Report Filter Customizer, enter any of the filter criteria described in Table 9-2.

    Note:

    Multiple conditional operators are supported for most string criteria. For more information about using Any, Equals, Like, Not Equal, or Not Like, see About the Message Report Filter Customizers.

  4. To revert any unsaved changes you made to the report filters, click Revert.
  5. When you are done specifying report filters, do any of the following:
    • To test your filter criteria, click Search, and then click the Show/Hide Filter toggle button.

    • To save the changes you made to the filter criteria for the report, click Save.

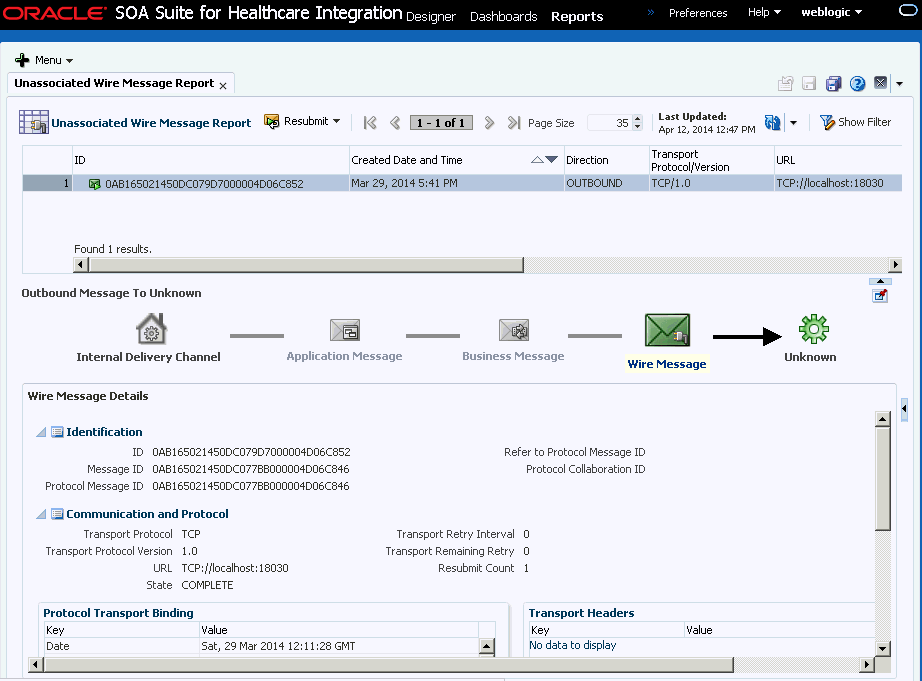
Figure 9-25 displays an Unassociated Wire Message Report, which lists all the outbound unassociated Wire Messages in the last 24 hours.

Figure 9-25 An Unassociated Wire Message Report
Description of Figure 9-25 follows
Description of "Figure 9-25 An Unassociated Wire Message Report"

You can sort the messages based on any of the report columns by clicking the column headers.

9.4.1.2 Viewing an Unassociated Wire Message

You can view an unassociated Wire Message from an Unassociated Wire Message report.

To view a wire message

  1. Display an unassociated Wire Message report on the Reports page.
  2. In the messages list, select the message for which you want to view instance data.

    The message flow diagram appears below the message list as shown in Figure 9-26.

    Figure 9-26 Unassociated Wire Message Flow

    Description of Figure 9-26 follows
    Description of "Figure 9-26 Unassociated Wire Message Flow"

    Note:

    The unavailable Business or Application Message icons are rendered as disabled in the message flow.

  3. To view the message details in a larger area, click Wire Message in the message flow diagram and then click the Collapse Pane button beneath the message list. You can also click Pin Current Message Details Into a New Tab to open a new page containing the detailed information.
  4. Expand or collapse sections of the unassociated Wire Message by clicking the arrow button next to the section you want to expand or collapse.
  5. To download information, click Download As XML or Download as Text in the section you want to download. However, because the message does not have any associated Business Message, Payload does not contain any data.

    Note:

    This option is not available in all sections.

  6. If you collapsed the message list pane, click Restore Pane above the message flow diagram to return to the message list.

9.4.2 Working with Unassociated Application Messages

A burst of Application Messages emitted by Fabric/Composite layer results in over-burdening the Oracle Healthcare runtime processing capacity. These messages then gets temporarily backlogged and marked as PROCESSING. As a result of which, these Application Messages do not have any associating Business Messages. Severe errors encountered by an outbound message from Fabric/Composite layer also results in Application messages without associated Business Messages.

9.4.2.1 Creating Unassociated Application Message Reports

You can create an Unassociated Application Message report in a way similar to creating General Application Message reports.

To create an unassociated application message report

  1. Perform Steps 1 and 2 from Creating Business Message Reports.
  2. On the Create Message Report dialog, enter a name for the report, select Unassociated Application Message Reports from the Report Type list, and click Create.

    The report appears with the Message Report Filter Customizer displayed.

  3. On the Message Report Filter Customizer, enter any of the filter criteria described in Table 9-3.

    Note:

    Multiple conditional operators are supported for most string criteria. For more information about using Any, Equals, Like, Not Equal, or Not Like, see About the Message Report Filter Customizers.

  4. To revert any unsaved changes you made to the report filters, click Revert.
  5. When you are done specifying report filters, do any of the following:
    • To test your filter criteria, click Search, and then click the Show/Hide Filter toggle button.

    • To save the changes you made to the filter criteria for the report, click Save.

[Reviewer: Please provide a sample Unassociated Application Message report image.]

You can sort the messages based on any of the report columns by clicking the column headers.

9.4.2.2 Viewing an Unassociated Application Message

You can view an unassociated Application Message from an Unassociated Application Message report.

To view an application message

  1. Display an unassociated Application Message report on the Reports page.
  2. In the messages list, select the message for which you want to view instance data.

    The message flow diagram appears below the message list as shown in.

    [Reviewer: Please provide an image of a sample Unassociated Application Message flow]

    Note:

    The unavailable Business Message button is rendered as disabled in the message flow.

  3. To view the message details in a larger area, click Application Message in the message flow diagram and then click the Collapse Pane button beneath the message list. You can also click Pin Current Message Details Into a New Tab to open a new page containing the detailed information.
  4. Expand or collapse sections of the unassociated Wire Message by clicking the arrow button next to the section you want to expand or collapse.
  5. To download information, click Download As XML or Download as Text in the section you want to download. However, because the message does not have any associated Business Message, Payload does not contain any data.

    Note:

    This option is not available in all sections.

  6. If you collapsed the message list pane, click Restore Pane above the message flow diagram to return to the message list.

9.5 Working with Error Messages

If processing for a message results in an error, the message appears in the message list with a red box over the icon.

You can select error message to view additional information about the error.

9.5.1 Viewing an Error Message

This report provides information related to errors in message processing, including the error message, code, severity, level, and description.

To view an error message

  1. Review the messages list to find messages with errors, as indicated by an error icon or a state of MSG_ERROR as shown in Figure 9-27.

    Figure 9-27 Error Message in Messages List

    Description of Figure 9-27 follows
    Description of "Figure 9-27 Error Message in Messages List"
  2. When you find an error message to view, select the message.

    The message flow diagram changes to display where the error occurred as shown in Figure 9-28.

    Figure 9-28 Message Flow Diagram With an Error

    Description of Figure 9-28 follows
    Description of "Figure 9-28 Message Flow Diagram With an Error"
  3. Click the error button in the message flow diagram.

    The error message details appear beneath the diagram as shown in Figure 9-29.

    Figure 9-29 Error Message Details

    Description of Figure 9-29 follows
    Description of "Figure 9-29 Error Message Details"

9.5.2 Resubmitting Messages

You can resubmit Wire and Application Messages from the Reports tab. When a message transaction contains an error, use the reporting features to determine the nature of the error and correct it. After the issue is fixed, resubmit the message. You can resubmit messages one at a time or in a group.

To resubmit a message

  1. In the messages list for the displayed report, select the message you want to resubmit.

  2. Do one of the following:

    • Select Resubmit, and then select Associated Application Message or Associated Wire Message.

    • Right-click the selected message and use the context menu items.

    • In the message flow diagram, right-click either Wire Message or Application Message, and then select Resubmit Wire Message or Resubmit Application Message.

  3. On the confirmation dialog that appears, click OK.

    The error icon on the message in the messages list changes to a green arrow to indicate the message was resubmitted.

To resubmit multiple messages

  1. In the messages list for the displayed report, select the messages you want to resubmit.

    A summary of information about the selected messages appears beneath the messages list as shown in Figure 9-30.

    Figure 9-30 Multiple Messages Selected on the Reports Page

    Description of Figure 9-30 follows
    Description of "Figure 9-30 Multiple Messages Selected on the Reports Page"
  2. In the yellow bar above the Selection Overview, click Resubmit, and then select Associated Application Message or Associated Wire Message. You can also use the Resubmit menu on the toolbar or right-click the selected message and use the context menu items.
  3. On the confirmation dialog that appears, click OK.

9.6 Purging Messages from the Repository

You can purge messages that you no longer want to store in the healthcare integration repository. If a message you purge is part of a batch process, all messages in the batch are also deleted.

You can purge messages one at a time or as a group.

To purge messages from the repository

  1. In the messages list of the displayed report, select the message or messages you want to remove.
  2. Click Purge.
  3. On the confirmation dialog that appears, click Yes.

Note:

When you a Business Message, the corresponding entry in the Sequence Manager table also gets deleted.

9.7 End-to-End Monitoring of Runtime Data

In an HL7 interface engine implementation that uses Oracle SOA Suite for healthcare integration, the reports page has the capability to associate the source HL7 endpoint data to multiple targets.

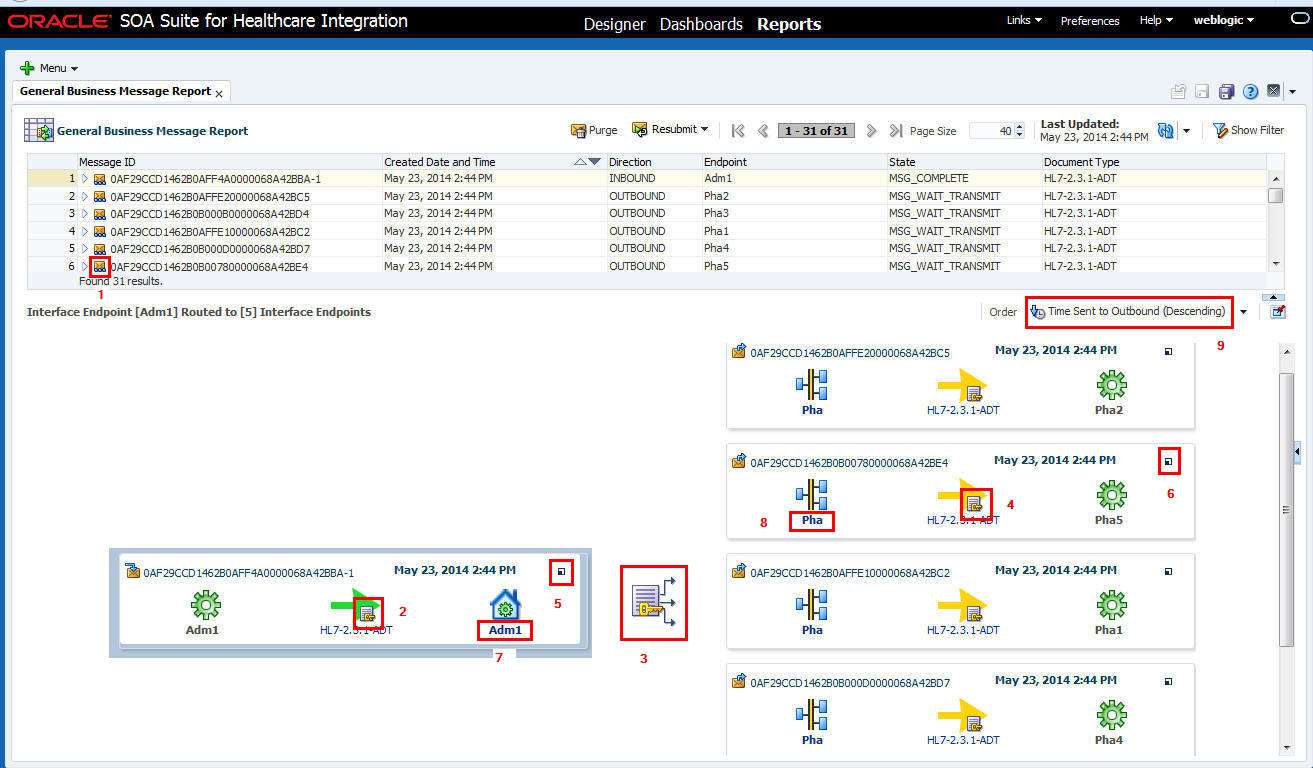
This is shown in Figure 9-31.

Figure 9-31 General Business Message Report Page
Description of Figure 9-31 follows
Description of "Figure 9-31 General Business Message Report Page"

Figure 9-31 shows the source HL7 endpoint Adm1 fanning out to five different targets (Pha1-5). As described in Viewing a Business Message Instance, you can view the business message details by clicking the button labeled "5" in Figure 9-31. This source to target(s) view is displayed only if you select messages with the icon labeled "1". Selecting messages without the icon displays the business message details.

Click the button labeled "2" in Figure 9-31to display the HL7 native data. The green arrow indicates that the segment is completed. A yellow arrow indicates the segment is in progress and a red arrow indicates the segment is in error. In Figure 9-31, the target endpoints are shown in the pending state. When successfully completed, the color of the arrows changes to green. The label beneath the arrow shows the document type and the version of HL7 messages being processed.

Click the button labeled "3" in Figure 9-31 to display the XML data of the endpoint that is in focus. For example, Figure 9-31 shows that the source endpoint Adm1 is in focus. Click the button labeled "3" to display the XML data from the source endpoint Adm1 (assuming translation is enabled). This XML data passes to the composite for routing and transformation. If the endpoint in focus is a target endpoint, click the button labeled "3" to display the XML data coming from the composite. Clicking the button labeled "3" results in different XML data values (if translation is enabled) depending on which endpoint is in focus. Also, note that the icons labeled "2", "3" and "4" have the image of a key embedded in them. The key indicates that if auditing functionality is turned on to the payload, the act of clicking these icons is logged for auditing purposes.

The icons labeled "7" and "8" indicate the internal delivery channels used to communicate to and from the composite; they can be JMS queue names or a composite. These icons cannot be selected and are meant to convey how these messages are passed to and from the composite.

By default, the icon labeled "9" shows the order of the target endpoints determined in descending order by the time sent. The order can be changed with other options such as "Time Sent to Outbound (Ascending)", "Outbound Endpoint Name (Ascending)" or "Outbound Endpoint Name (Descending)" This feature is useful if there are multiple target endpoints and you want to determine if the target endpoints are processed. If the HL7 message is not passed from the composite to the target endpoint, the endpoint is not displayed in this report page.

Note:

By default, the outbound messages are shown as flowing from left to right. You can use the User Interface Settings page (Administration > Settings > UI) to change the flow to be right to left by setting Show Outbound Message Flow in Right-to-Left Order to Yes.