22 Monitoring Decision Service Service Components and Engine
This chapter includes the following topics:
-
Monitoring Business Rules Service Engine Performance Statistics
-
Monitoring Business Rules Service Engine Deployed Components
For information about business rules tuning and performance parameters, see Tuning Performance.
Note:
The business rules service engine does not support any user level configuration.
Monitoring Business Rules Service Engine Performance Statistics
Using the business rules service engine Statistics page, you can monitor business rules service engine performance and metrics. This page shows service engine-level, not component-level, details. Business rules service components are also called Decision Service service components in the Oracle Fusion Middleware documentation.
To monitor business rules service engine statistics:
-
Access the business rules service engine statistics page through one of the following options:
From the SOA Infrastructure Menu... From the SOA Folder in the Navigator... Select Service Engines > Business Rules.
-
Select soa-infra.
-
Right-click and select Service Engines > Business Rules.
-
-
Click Statistics.
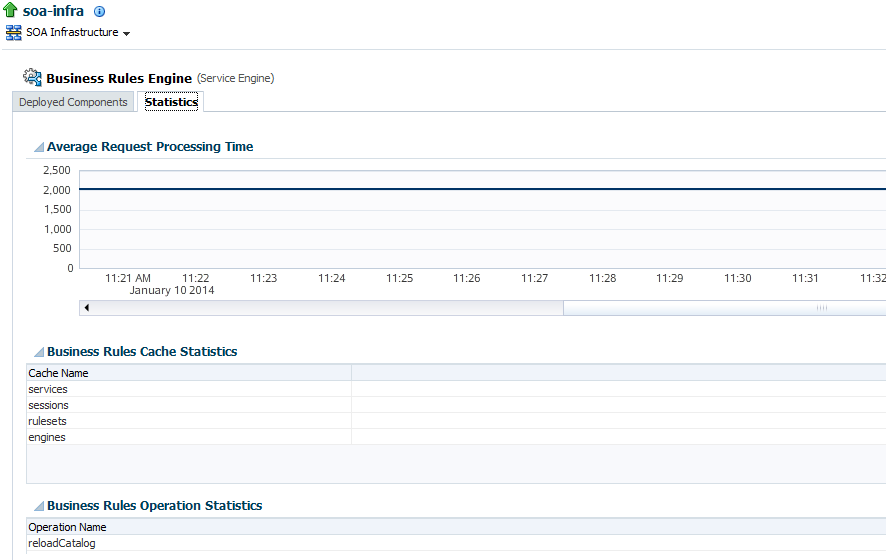
The Statistics page displays the following:
-
Average Request Processing Time: This chart displays the average request processing time of the business rules service engine since server startup. That is, how many requests were processed by the service engine per unit of time.
-
Business Rules Cache Statistics: This section provides details about the service engine cache. This section lists the types of caches used by the service engine and the object count in each of the caches. All these metrics are based on the object count since server startup.
-
Business Rules Operation Statistics: This section shows the operation statistics. Using the operation statistics, you can determine the number of calls to Oracle Business Rules decision functions since server startup, and determine the total time spent in Decision Functions since server startup.
Note:
When you view business rules operation statistics for composite applications created with Oracle Fusion Middleware 11g Release 1 (11.1.1), the only operation shown is the callFunction operation. In this release, the Decision Service service only calls Oracle Business Rules using decision functions, and this operation is indicated with values for the operation named callFunction (with Count and Average(ms) fields). With composite applications that were migrated from older releases, the Decision Service service performs callFunction operations and the other operations listed in the Business Rules Operation Statistics section. For these migrated projects, you can debug the flow of the request through various important operations within the service engine. Also, you can find any long-running operations and take the necessary actions. These metrics also are since server startup.
For information about business rules tuning and performance parameters, see Tuning Performance.
-
Monitoring Business Rules Service Engine Deployed Components
Using the Deployed Components page, you can monitor all Decision Service service components deployed across SOA composite applications. Decision Service service components are also called business rules components in the Oracle Fusion Middleware documentation.
To monitor business rule service engine deployed components:
-
Access the business rules service engine Deployed Components page through one of the following options:
From the SOA Infrastructure Menu... From the SOA Folder in the Navigator... Select Service Engines > Business Rules.
-
Right-click soa-infra.
-
Select Service Engines > Business Rules.
-
-
Click Deployed Components.
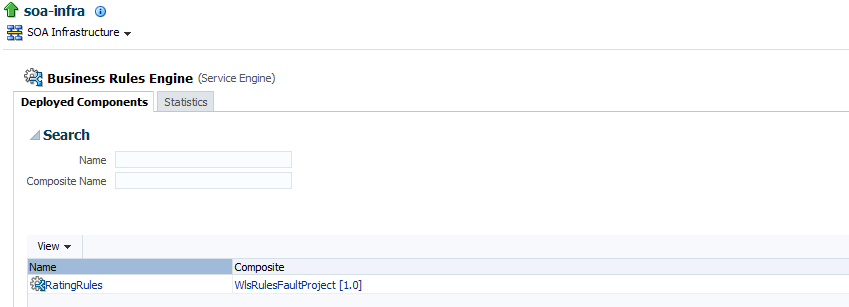
The Deployed Components page displays the following:
-
A utility for searching for a specific component by specifying criteria and clicking Search.
-
A list of components, including the name, the SOA composite application name, and the status (up or down).
-
-
In the Name column, click a name to navigate to the Component home page and view component details.
-
In the Composite column, click a specific SOA composite application to access its home page.
For more information, see Introduction to Service Components.
Monitoring Business Rule Tracing
You can use Oracle Enterprise Manager Fusion Middleware Control to perform rule execution tracing. For more information about accessing and using Fusion Middleware Control, see Getting Started with Administering and Oracle BPM Suite.
A rule execution trace is a mechanism of tracing business rules service engine events that occur during the evaluation of rules. The types of events traced are:
-
Fact operations (assert, retract, and modify)
-
Rules execution
-
Rule activation
-
Ruleset stack changes
-
Rule compilation
-
Reset (required for maintaining state during analysis)
Each trace contains information about the event that it traces. For example, a rule trace entry for an executed rule consists of:
-
Rule name (RL name)
-
Execution sequence number
-
List of fact IDs for the facts that matched this rule
-
Timestamp in milliseconds
Rule execution trace audit levels are the same as the audit levels supported in the SOA Infrastructure:
-
Off: Rule execution tracing is disabled. The decision component instance is not created at all.
-
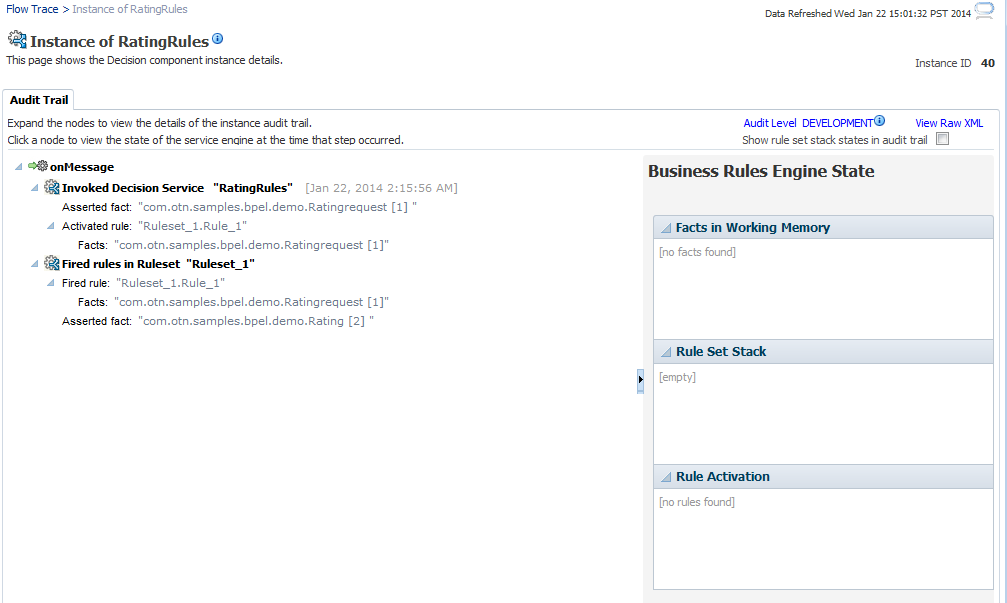
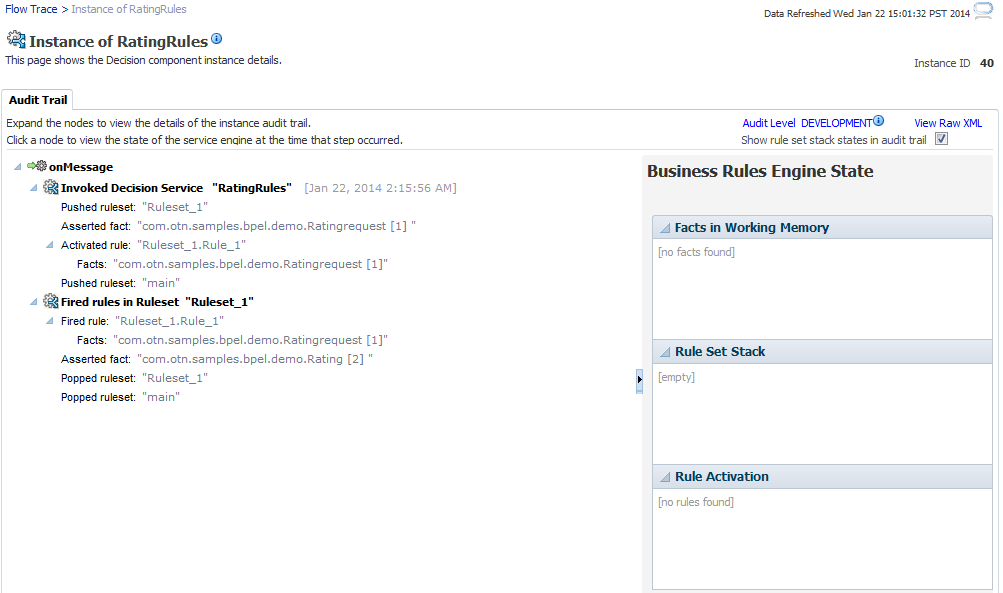
Development: Full rule execution tracing that contains all the details about facts (listing, operations such as modify and assert), rule activation, pop or push rulesets, and so on. It also provides a list of fact IDs on which the executed rules are matched. See Tracing Rule Execution at the Development Audit Level for an example.
-
Production: The executed rules are traced. All the details about facts, rule activation, pop or push ruleset are not available. The trace do not contain a list of the matching facts IDs. See Tracing Rule Execution at the Production Audit Level for an example.
You can set audit levels either at the SOA Infrastructure level or at the composite level. See Configuring SOA Infrastructure Properties for SOA Infrastructure audit level configuration information. See Introduction to the Order of Precedence for Audit Level Settings for a discussion about audit level precedence when set at the SOA Infrastructure level and the composite level.
The following sections discuss setting audit levels at the composite level for the purposes of rule execution tracing.
Tracing Rule Execution at the Development Audit Level
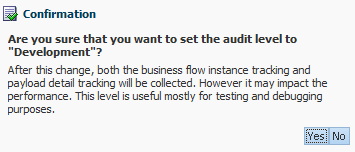
By setting the audit level to Development you can view all the details pertaining to a rule that has been executed.
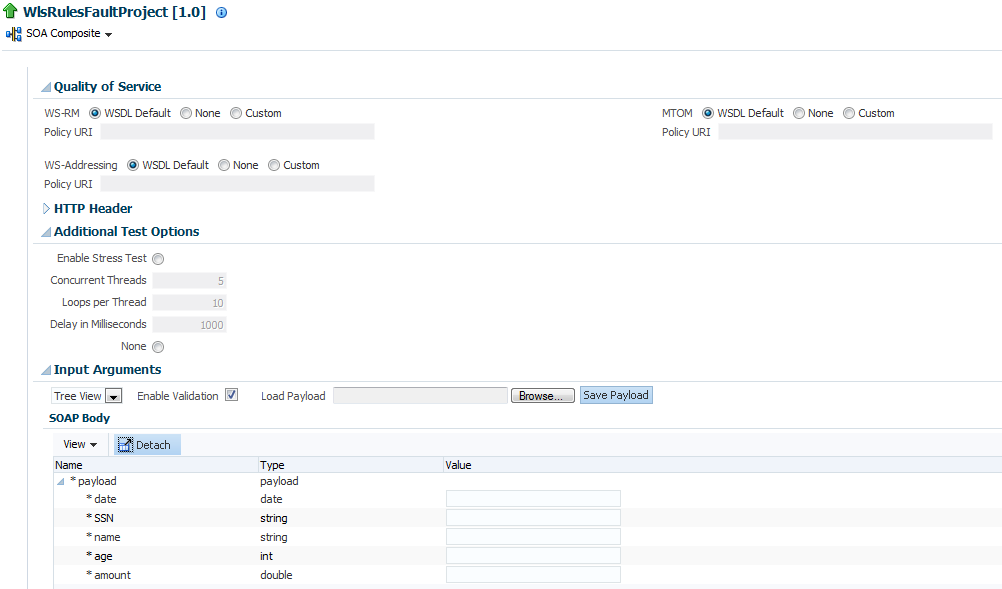
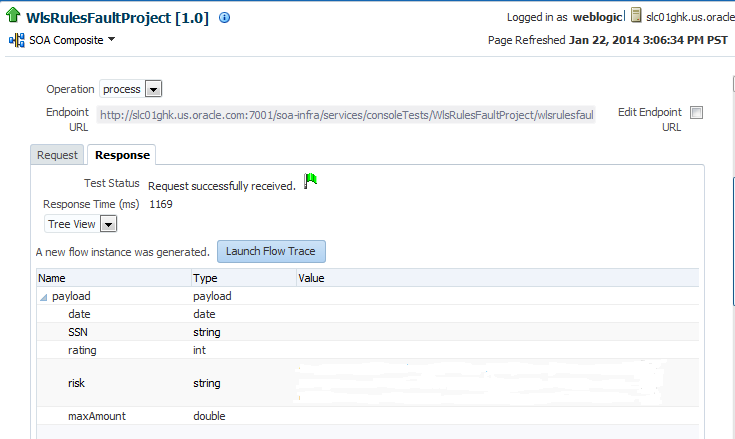
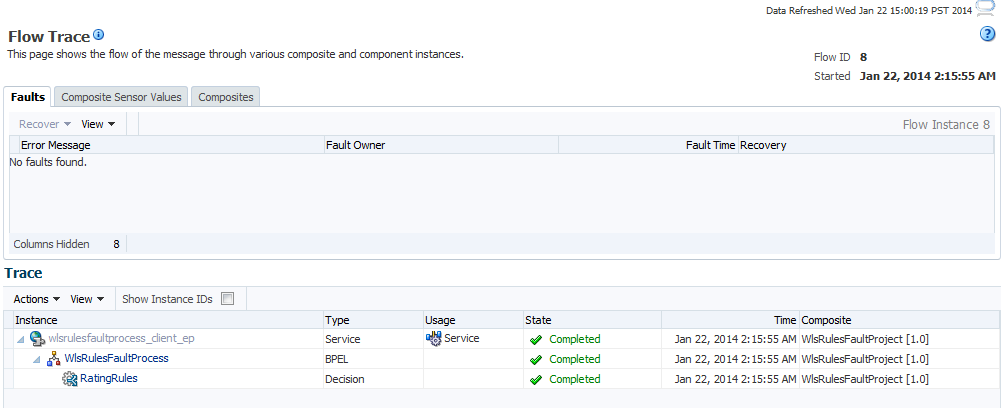
To perform a development-level rule execution trace:
Tracing Rule Execution at the Production Audit Level
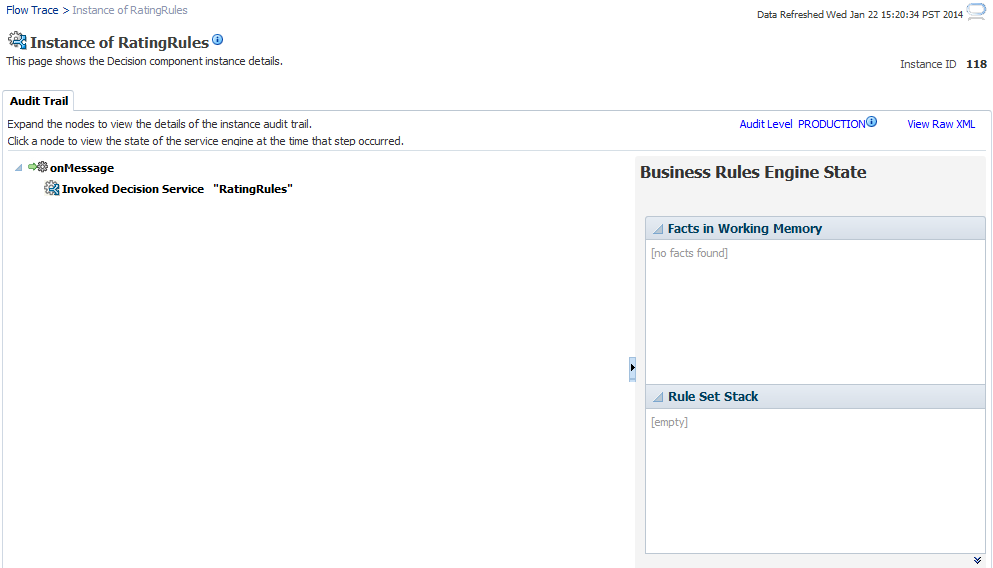
Setting the audit level to Production provides a truncated report on the rule execution trace. It only displays the ruleset and the rules that have been fired and does not display details about facts, rule activation, and so on.
The process of production-level tracing is similar to the development-level tracing. However, for Production-level tracing, you must do the following:
In Fusion Middleware Control, after opening the composite, select Production from the Composite Audit Level of the Settings menu.
Figure 22-1 shows the Flow Trace page that displays the trace report.
Figure 22-1 Flow Trace Audit Trail - Production
Description of "Figure 22-1 Flow Trace Audit Trail - Production"
The Production-level trace report contains only the name of the ruleset and the rules that were fired. In addition, the Show rule set stack states in audit trail check box that provides a drill-down detailed trace report is unavailable in the Production-level trace report.
