12 Gaining Business Insights with Oracle Business Activity Monitoring
This chapter includes the following sections:
12.1 Business Challenge
Company X has a requirement to gain business insights into the customer ordering system to identify the following trends:
-
The number of orders approved, received, or rejected.
-
The reasons for rejections, such as insufficient income, credit, or age.
-
The number of automatic or manual credit card approvals per state.
12.2 Business Solution
To address this business challenge, Company X designs a business solution that uses the components described in Table 12-1.
Table 12-1 Components That Provide the Business Solution
| Component | How This Component Addresses The Business Challenge | Component Description |
|---|---|---|
|
Process analytics |
Process analytic measurements and business indicators are defined on activities in a BPEL process. |
Process analytics provide a uniform measurement mechanism for collecting disparate data in BPEL processes. |
|
Oracle BAM |
When a SOA composite is configured with analytics measurements and business indicators, composite-specific physical and logical data objects are automatically created in Oracle BAM upon the composite's deployment. Oracle BAM Composer is used to create a dashboard of these analytics to gain business insights into customer order requests. |
Oracle BAM monitors business processes in real time to help you make informed tactical and strategic business decisions. |
Subsequent sections of this chapter provide more specific details about how the components in Table 12-1 are used to address the business insight challenge.
12.2.1 Adding Business Indicators and Measurements to a Composite
Oracle SOA Suite provides a uniform process schema across components such as BPEL processes, Oracle BPM, and human workflow. Oracle BAM models this schema as data objects that are persisted in the Oracle BAM server. These data objects are preseeded and populated by the processes automatically.
Oracle SOA Suite provides a feature called process analytics. This feature enables Company X to specify user metrics such as business indicators and measurements on activities in a BPEL process. When the composite is deployed, corresponding, custom, derived data objects are created and updated in Oracle BAM.
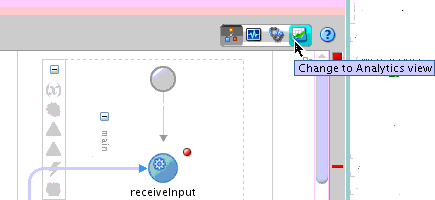
Company X opens a BPEL process in Oracle JDeveloper (for this scenario, named CCComposite) in which to specify user metrics and clicks the Change to Analytics view icon, as shown in Figure 12-1. This opens the process in analytics view. Analytics view enables you to define business indicators and measurements in the BPEL process.
Figure 12-1 Analytics View in a BPEL Process
Description of "Figure 12-1 Analytics View in a BPEL Process"
-
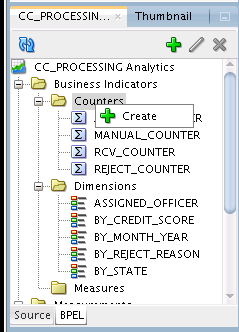
Business indicators are defined in the Structure window, and consist of the following:
-
Counters: Track the number of times a process instance completes a marked element such as a BPEL activity.
-
Dimensions: Label group or filter measures.
-
Measures: Store the values of a variable such as a sales amount, an employee salary, and so on.
Figure 12-2 shows defined business indicators in the Structure window.
Figure 12-2 Business Indicators Defined in the Structure Window
Description of "Figure 12-2 Business Indicators Defined in the Structure Window"
-
-
Measurements are displayed in the Components window, and are dragged and dropped onto activities for configuration. The following types are available:
-
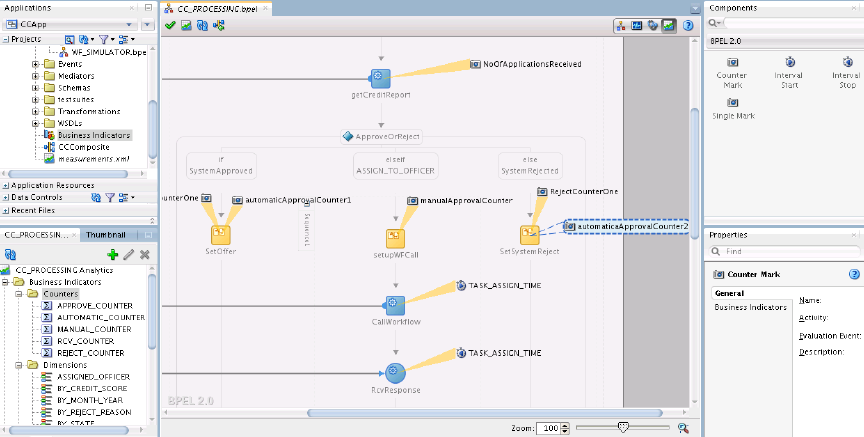
Counter mark: The BPEL activity on which the counter mark is taken. In this BPEL process, Company X defines counter marks for tracking the number of manual approvals, automatic approvals, and rejected orders.
-
Interval start: The BPEL activity on which the interval starts.
-
Interval stop: The BPEL activity on which the interval ends.
-
Single mark: The BPEL activity on which the single mark is taken.
Figure 12-3 provides details. Measurements that have been dragged from the Components window onto appropriate BEPL activities and configured are indicated by text annotations. The defined business indicators are displayed in the Structure window.
-
Figure 12-3 BPEL Process with Defined Business Indicators and Measurement Analytics
Description of "Figure 12-3 BPEL Process with Defined Business Indicators and Measurement Analytics"
When a SOA composite is configured with analytics measurements and business indicators, composite-specific physical and logical data objects are automatically created in Oracle BAM upon the composite's deployment. These composite-specific data objects have the columns for business indicators and are populated with analytics information corresponding to processes in that composite.
12.2.2 Gaining Business Insights with Oracle BAM Dashboards
Company X deploys the composite, which begins processing order requests.
When Company X specifies business indicators and measurements in a SOA composite application, corresponding, custom, derived data objects are created and updated in Oracle BAM when the composite is deployed. Oracle BAM data objects are populated with appropriate analytics as per the measurements defined in the composite.
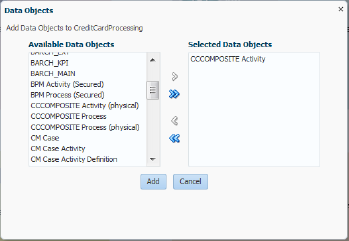
Company X logs in to Oracle BAM Composer and creates a new project named Credit Card Processing in Oracle BAM Composer. During creation, Company X adds the activity data object corresponding to the deployed CCComposite composite into the project, as shown in Figure 12-4. These composite-specific data objects have the columns for business indicators and are populated with analytics information corresponding to processes in that SOA composite.
Figure 12-4 Activity Data Object Selection
Description of "Figure 12-4 Activity Data Object Selection"
Company X then creates a dashboard with a display name of Credit Card Processing in the project. Oracle BAM provides a rich set of ready-to-use dashboards for all major components of Oracle BPM Suite and Oracle SOA Suite. These dashboards include metrics such as task queue depth and bottleneck analysis of business processes.
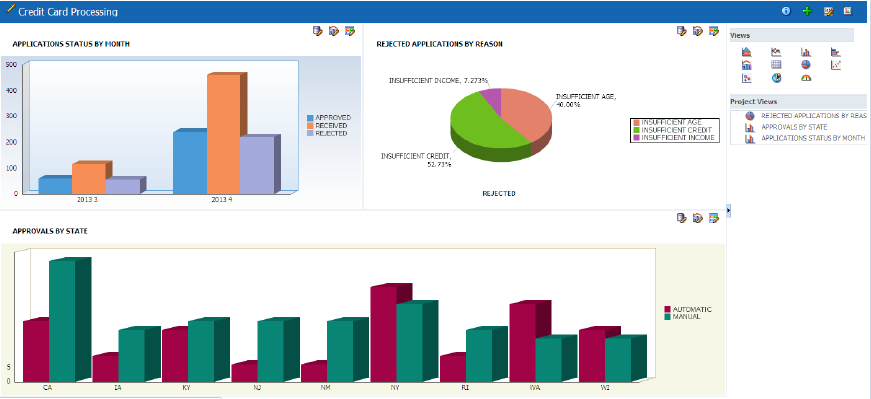
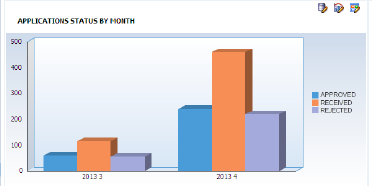
Company X designs a bar graph with three different counters for displaying the approved, received, and rejected applications by month.
-
A display name of APPLICATIONS STATUS BY MONTH.
-
A business view query modeled with measurements and dimensions that Company X designed in the CCComposite composite in Oracle JDeveloper.
-
A data object of /oracle/processanalytics/CCComposite Activity.
-
A counter for APPROVE_COUNTER BI (Display name is changed to APPROVED).
-
A counter for RCV_COUNTER BI (Display name is changed to RECEIVED).
-
A counter for REJECT_COUNTER BI (Display name is changed to REJECTED).
-
A time dimension of one month.
-
Figure 12-5 provides details.
Figure 12-5 Bar Graph for Displaying the Approved, Received, and Rejected Applications by Month
Description of "Figure 12-5 Bar Graph for Displaying the Approved, Received, and Rejected Applications by Month"
Company X designs a second bar graph for tracking the number of manual and automatic approvals by state.
-
A display name of APPROVALS BY STATE.
-
A business view query modeled with measurements and dimensions that Company X created in the CCComposite composite in Oracle JDeveloper.
-
A data object of oracle/processanalytics/CCComposite Activity.
-
A counter for AUTOMATIC_COUNTER BI (Display name is changed to AUTOMATIC).
-
A counter for MANUAL_COUNTER BI (Display name is changed to MANUAL).
-
A dimension based on state.
-
Figure 12-6 provides details.
Figure 12-6 Second Bar Graph for Tracking the Number of Manual and Automatic Approvals by State

Description of "Figure 12-6 Second Bar Graph for Tracking the Number of Manual and Automatic Approvals by State"
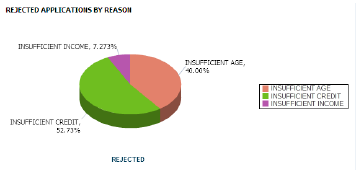
Company X designs a pie graph to the right of the APPLICATIONS STATUS BY MONTH graph to track the number of rejected applications due to different reasons.
-
A display name of REJECTED APPLICATIONS BY REASON.
-
A business view query modeled with measurements and dimensions that Company X created in the CCComposite composite in Oracle JDeveloper.
-
A data object of oracle/processanalytics/CCComposite Activity.
-
A counter for (REJECT_COUNTER BI) (Display name is changed to REJECTED).
-
A dimension set to BY REJECT REASON (due to insufficient age, credit, or income).
-
A Text Type set to Text and Percentage for the pie slice.
-
Figure 12-7 provides details.
Figure 12-7 Pie Graph to Track the Number of Rejected Applications Due to Different Reasons
Description of "Figure 12-7 Pie Graph to Track the Number of Rejected Applications Due to Different Reasons"
When complete, the entire dashboard looks as shown in Figure 12-8.
12.3 Related Documentation
Table 12-2 provides references to documentation that more specifically describes the features described in this chapter.
Table 12-2 Related Documentation
| For Information About... | See... |
|---|---|
|
Creating process analytics |
"Configuring BPEL Process Analytics" of Developing SOA Applications with Oracle SOA Suite |
|
Designing Oracle BAM dashboards |
"Planning and Creating Projects" of Monitoring Business Activity with Oracle BAM "Creating Dashboards" of Monitoring Business Activity with Oracle BAM "Creating Business Queries" of Monitoring Business Activity with Oracle BAM |
