23 Working with Data Visualizations

Create, configure, and manage data visualizations using visualization templates to explore retrieved data visually.

Permissions:

To perform the tasks in this chapter, you need one of the following portal-level permissions:

  • Assets: Create, Edit, and Delete Assets or Create Assets and Edit Assets (standard permissions)

  • Application Integration Visualization: Manage Application Integration Visualization (advanced permissions)

See About Roles and Permissions for a Portal.

Note:

For a SQL data source, the database permissions required to view, update, or insert data using a data visualization are the same permissions that are required to view, update, or insert data into a table in the database.  These permissions may include CONNECT, SELECT, CREATE INDEXTYPE, CREATE SEQUENCE, CREATE SESSION, and CREATE TABLE. At a minimum, you will need CONNECT, RESOURCE, CREATE SESSION, and CREATE TABLE permissions to view and update the visualization, but you may require additional permissions depending on your specific use case.

About Data Visualizations

WebCenter Portal can retrieve data from a REST or SQL data source using a business object, simplifying the complexities of application integration. The retrieved data can be rendered on a portal page in a data visualization using a visualization template. For example, the data can be presented in one of the built-in visualization templates, or a developer can build a custom visualization template in JDeveloper.

The basic steps to accomplish this are:

  1. Create data source. Create a REST or SQL data source from which to retrieve the data to present on the page (see Creating a REST Data Source and Creating a SQL Data Source).

  2. (Optional) Create business object. If you need to filter the attributes and methods retrieved from the data source, create a business object (see Creating a Business Object). If you do not create a unique business object, one is automatically created when a data source is selected in the Define Data Visualization wizard, and all the attributes and methods for the data source are added to the business object. Manually-created business objects are listed on the portal Assets page and in the Define Data Visualization wizard, but automatically-created business objects are internal and not exposed anywhere.

  3. Determine visualization template. Decide if you can use one of the built-in visualization templates (see About the Built-In Visualization Templates), or if you need to work with a developer to create a custom visualization template. When a custom visualization template is uploaded to a portal, it is shown on the Assets page for the portal; it can also be made available as a shared asset, available to all portals.

  4. Configure data visualization. Add a data visualization component (Data Presenter Visualization) to a page, then configure the component to define the data visualization that you want to render on the page (see Configuring a Data Visualization).

Out-of-the-box, no data visualizations exist. Data visualizations can be created only at the portal level (as a portal asset), not at the application level (as a shared asset).

Adding a Data Visualization a Portal Page

To add a data visualization to page, you start by adding the default Application Integration Visualization component to the page. Then, you can configure this component to create the unique data visualization that you require. For more information, see About Data Visualizations.

To add a data visualization to a portal page:

  1. Open the page in which you want to present the data in the page editor.

    For more information, see Opening a Page in the Page Editor.

  2. Click Add Content in the area of the page where you want to add the data visualization to open the resource catalog.
  3. In the resource catalog, find and select Data Presenter Visualization to add the Application Integration Visualization component to the page (Figure 23-1.

    Tip:

    The location of Application Integration Visualization component in the resource catalog depends on the resource catalog being used by the page. For example, in the Default Portal Catalog, the Application Integration Visualization component is in the Application Integration folder.

    Figure 23-1 New Application Integration Visualization Component

    New Application Integration Visualization Component
    The new data visualization is shown on the portal Assets page, but you cannot edit, copy, or delete it from the Assets page. To make changes to the data visualization, you can edit the page and click Configure on the Application Integration Visualization component.
  4. Configure the data visualization to create a unique data visualization that presents the data retrieved by a business object in a visualization template, as described in Configuring a Data Visualization.

Configuring a Data Visualization

After you add a data visualization to a page, you can configure the data visualization to present the data retrieved from a data source in a visualization template.

Note:

If changes are made to a custom visualization template or the structure of data retrieved from the data source that is selected in a data visualization, you will need to configure a new data visualization to successfully generate the results of the changes on the page.

To configure a new or existing data visualization:

  1. Open the page that includes the data visualization in the page editor.

    For more information, see Opening a Page in the Page Editor.

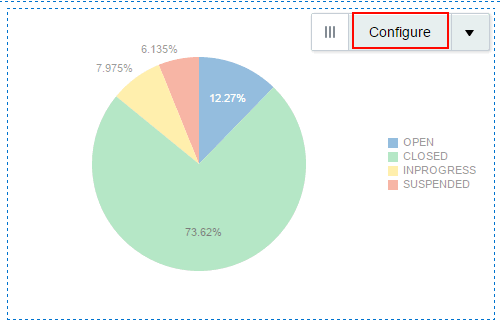
  2. Select the data visualization on the page, then click Configure (Figure 23-2 and Figure 23-3) to open the Define Data Visualization wizard (Figure 23-4).

    Figure 23-2 Configure Data Visualization: New

    Configure Data Visualization: New

    Figure 23-3 Configure Data Visualization: Existing

    Configure Data Visualization: Existing

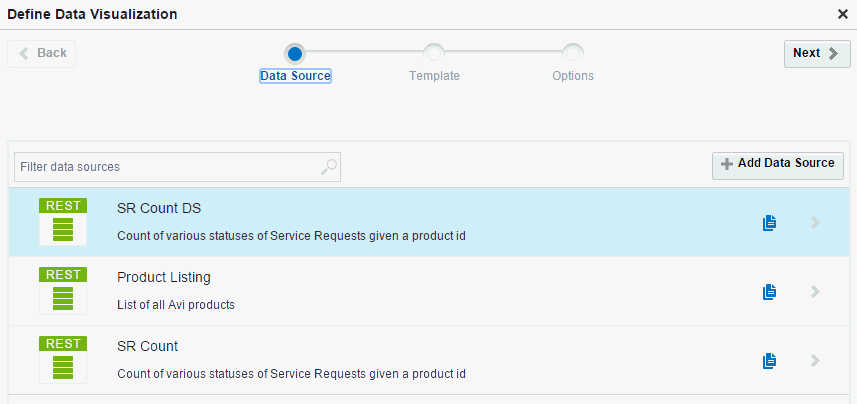
    Figure 23-4 Define Data Visualization Wizard

    Define Data Visualization Wizard
  3. On the Data Source page, select an existing SQL or REST data source and go to the next step, or create a new REST data source with limited options as follows:

    Note:

    • The Define Data Visualization wizard supports basic REST data source creation and editing. If you require a REST data source with more options, see Creating a REST Data Source. After creating the data source, you can select it in the Define Data Visualization wizard.

    • If you want to select an existing REST data source, but know that the underlying data has changed, you can exit the wizard and go to the Assets page of the portal to edit the data source, where you can select Refresh Schema to refresh the data source and associated business object with changes such as added, deleted, or renamed attributes. For more significant structural changes, you will need to re-create the data source, and any data visualizations where it is used.

    1. Click the icons in the row for an existing data source to Copy or Edit the data source, or click Add Data Source to create a new REST data source.
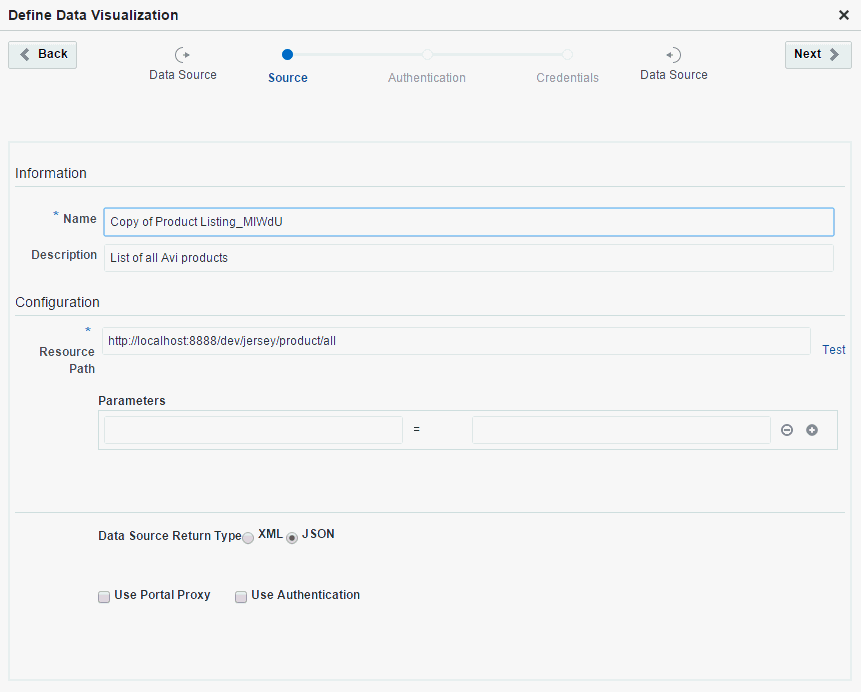
    2. In the Data Source wizard, on the Source page, enter a Name and optional Description for the REST data source.

      Figure 23-5 Data Source Wizard: Source Page

      Data Source Wizard: Source Page
    3. Enter a valid Resource Path URL against which the REST data source will be created, then click Test to confirm the resource path is valid and that it returns data. For example, the resource path http://dev.markitondemand.com/Api/v2/Quote?symbol=AAPL provides stock quotes.

      Note:

      The Resource Path must support at least the GET method, along with any other method (PUT, POST, DELETE).
    4. In the list of Parameters populated based on the resource path provided, remove or add parameters as needed.

      Note:

      If you modify the Resource Path URL, the list of parameters will be refreshed, and you may need to respecify the required data source parameters.
    5. Select a Data Source Return Type that specifies data type returned by the Resource Path URL. A URL can return data in either XML format or JSON format.
    6. Select or deselect Use Portal Proxy and Use Authentication as required. For an external URL, select Use Portal Proxy.
    7. Click Next.
    8. If you selected Use Authentication:
      • On the Authentication page, select existing credentials, or click Add Credentials to create a new credential (if you have been granted the required permission to create a new credential).

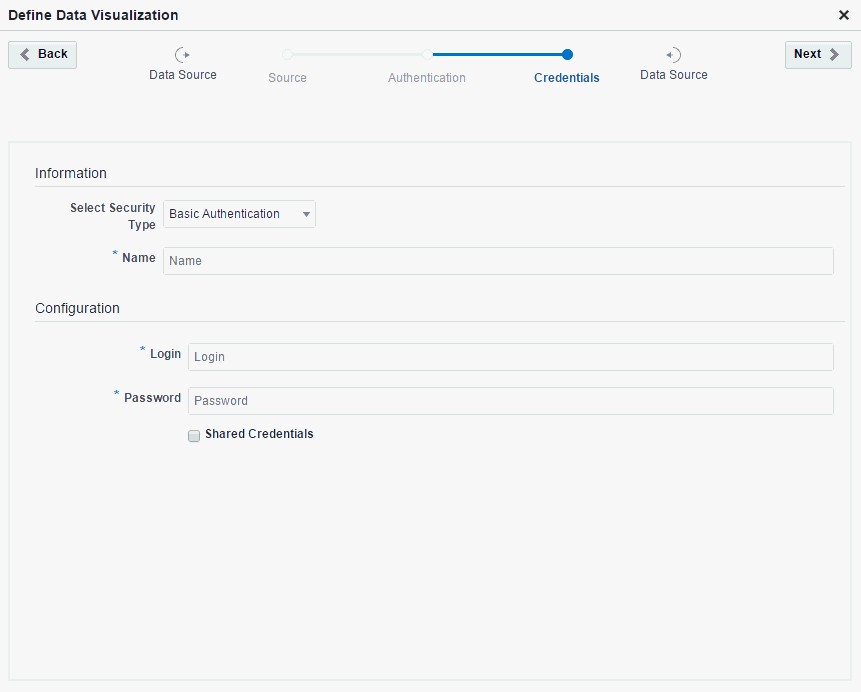
      • On the Credentials page, select from the Select Security Type list:

        • Basic Authentication support is provided through the External Application Service of WebCenter Portal. The username and password for the REST service are stored in the OPSS Credential Store using the External Application Service. When a data visualization is rendered at runtime, WebCenter Portal retrieves these credentials to present the data on the page.

        • OAuth support is provided by OWSM integrated with REST Data Control. ADF REST Data Control supports only OAuth 2.0 using IDM OAuth Servers. External REST services that are protected using a non-IDM solution are not supported.

        • Taleo Token Generator authentication is provided by a custom security provider to propagate security at runtime. If authentication is successful, a Taleo token is issued. That token must be passed to each subsequent resource request to retrieve data.

        Figure 23-6 Data Source Wizard: Credentials Page

        Data Source Wizard: Credentials Page
      • Under Configuration, define or edit the login information, depending on the security type:

        • For Basic Authentication, enter the Login user name, and Password.

        • For OAuth, enter the Login user name, and Password corresponding to the Client ID and Password configured in OAuth server, and enter the Token Generator URL of the OAuth Server.

        • For Taleo Token Generator, enter the Login user name, and Password, and enter the Login URL and Org Code to access the Taleo end point. A user must be authenticated using user name, password, and organization code (company ID) on a defined login URL.

  4. Click Next to display the Template page.

    Figure 23-7 Define Data Visualization Wizard: Template Page

    Define Data Visualization wizard: Template Page
  5. On the Template page:
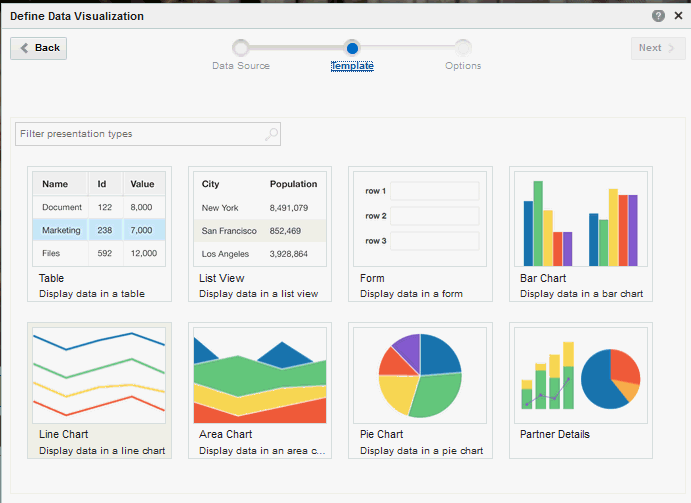
    1. Select a visualization template (presentation type) to present the data retrieved from the data source.

      The templates shown are those that are appropriate for the currently selected data source. When you provide the Resource Path URL, WebCenter Portal creates the data source based on the data returned by the URL. If the URL returns only a single record at this time (possibly due to parameter values or limited data currently available), then WebCenter Portal creates the data source with the assumption that a single record will always be returned. In this case, the wizard shows only the Form template for selection, since this template is appropriate for presenting a single data record. It does not show the Table or List templates for selection, because these templates are appropriate for repeating records of data. If you know that the data retrieved by the data source may be repeating and you want to select the List or Table templates, then the Resource Path URL that you specify must return repeating data at the time that the data source is created. Alternatively, you can create a data source on the Assets page, and provide a Response Payload that contains repeating data. Then, if you select that data source here, the wizard will present all appropriate templates for selection, including List and Table.

      Figure 23-7 shows the built-in templates, along with one custom template named Partner Details. For more information about the built-in visualization templates, see About the Built-In Visualization Templates. Custom visualization templates are developed in JDeveloper and uploaded to a portal, as described in Creating or Editing a Visualization Template.

      Note:

      If you select a custom visualization template that was just published while you are in the page editor configuring the data visualization, you may encounter an error. To achieve expected results, do not enter the page editor until after the custom visualization template is published.
    2. Click Next to display the Options page for the selected template, showing two tabs: Settings and Parameters.
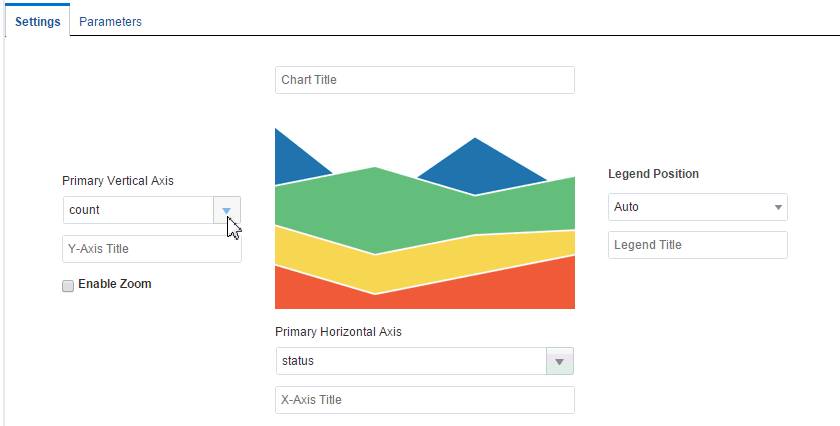
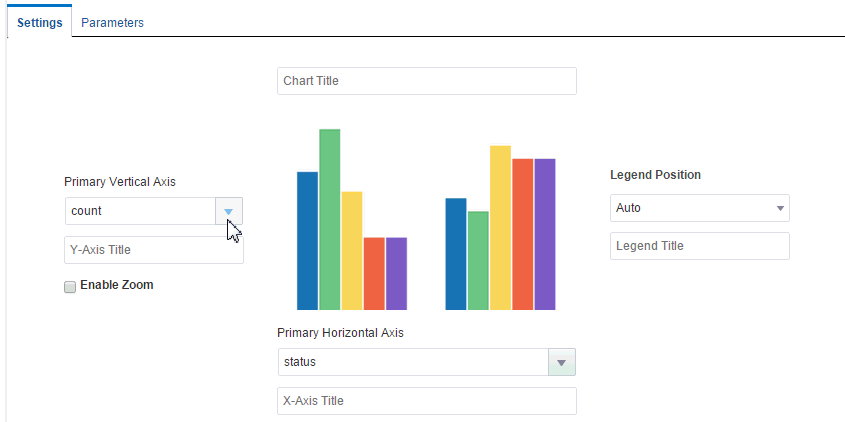
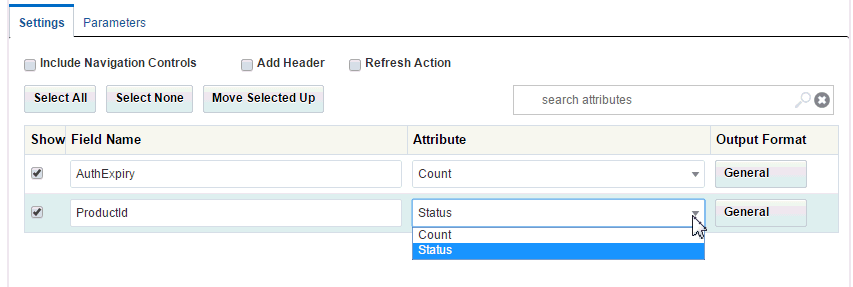
  6. On the Settings tab, select and set elements to add to the visualization of the retrieved data on the page, dependent on the template you selected.

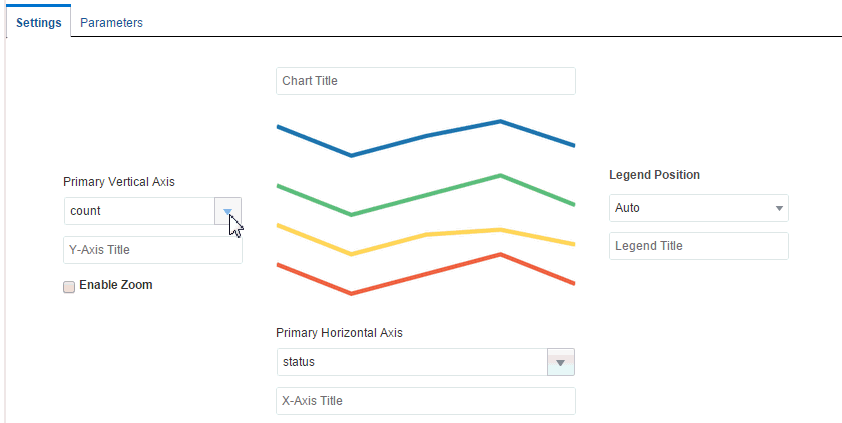
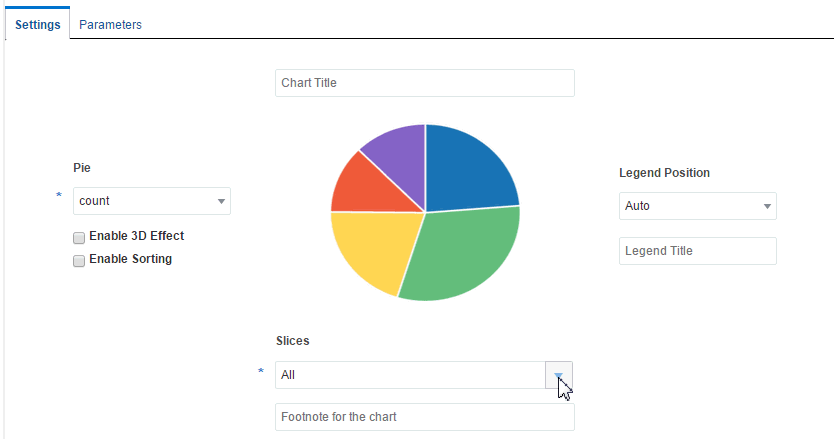
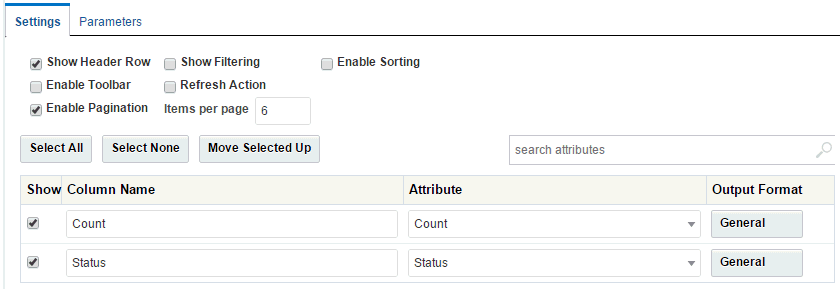
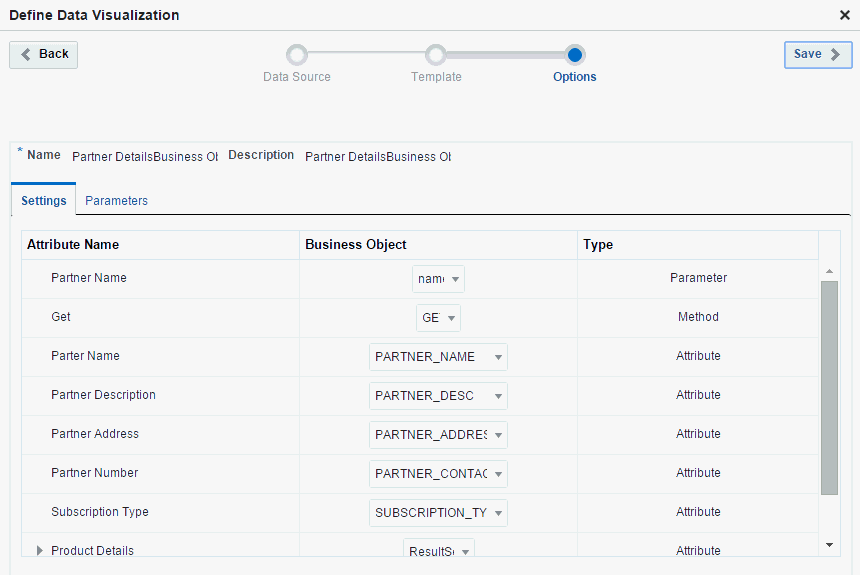
    Table 23-1 shows the elements available for built-in and custom visualization templates.

    Table 23-1 Visualization Template Settings

    Template Settings Page Settings

    Area Chart

    Area chart template settings

    Chart Title

    Primary Vertical Axis and Primary Horizontal Axis

    Y-Axis Title and X-Axis Title

    Enable Zoom

    Legend Position

    Legend Title

    Bar Chart

    Bar chart template settings

    Chart Title

    Primary Vertical Axis and Primary Horizontal Axis

    Y-Axis Title and X-Axis Title

    Enable Zoom

    Legend Position

    Legend Title

    Form

    Form template settings

    Include Navigation Controls

    Add Header

    Refresh Action

    Show

    Field Name

    Attribute (available business object and data source attributes)

    Output Format (see next step)

    Line Chart

    Line chart template settings

    Chart Title

    Primary Vertical Axis and Primary Horizontal Axis

    Y-Axis Title and X-Axis Title

    Enable Zoom

    Legend Position

    Legend Title

    List View

    List View template settings

    Fetch Size

    Show

    Column Name

    Attribute (available business object and data source attributes)

    Output Format (see next step)

    Pie Chart

    Pie chart template settings

    Chart Title

    Pie

    Enable 3D Effect

    Enable Sorting

    Slices

    Footnote for the chart

    Legend Position

    Legend Title

    Table

    Table template settings

    Note: If you select Enable Filtering, you can filter data in view mode. Filtering in edit mode does not generate expected results.

    Show Header Row

    Show Filtering

    Enable Sorting

    Enable Toolbar

    Add Header

    Refresh Action

    Enable Pagination

    Items per page

    Show

    Column Name

    Attribute (available business object and data source attributes)

    Output Format (see next step)

    Custom template example

    Custom visualization template settings Unique to custom template
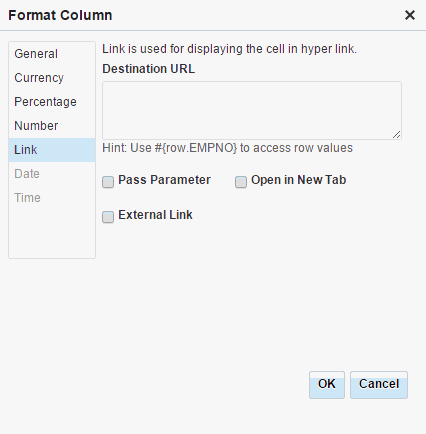
  7. For templates that define an Output Format for retrieved data, click the current output format (such as General) for a data item to open the Format Column dialog.

    Specify the format for the data item as required, selecting General, Currency, Percentage, Number, Link.

    Notes:

    • For Link, the URL must be either a full URL (beginning with http://) or a URL relative to the portal’s web address.

    • In a Table visualization, filtering on a column is not supported. If the SQL query selects data from a database column that includes a timestamp, you must convert the database column to date format in the SQL query when you create the SQL data source as in the following example:

      TO_DATE(TO_CHAR(date_timestamp_column,'MM/dd/yyyy'),'MM/dd/yyyy') 

    Figure 23-8 Format Column Dialog

    Format Column dialog
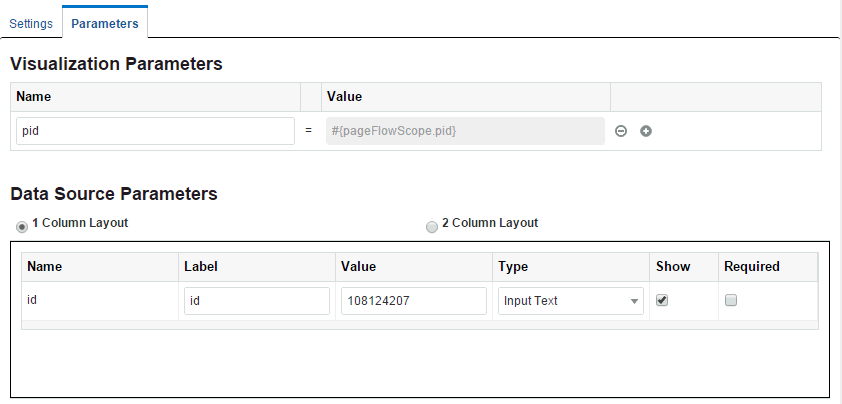
  8. On the Parameters tab, define:
    • Visualization Parameters to get input from other components to the page

    • Data Source Parameters to retrieve the data from the data source

    Using this tab, you can pass a visualization parameter value to a data source parameter. This creates the master-detail relationship where one visualization can pass values to another visualization, and then this value is passed to a data source through data source parameters to make a back data query. You have the option to create or delete visualization parameters. New data visualizations do not have any parameters.

    Figure 23-9 Define Data Visualization Wizard: Options Page (Parameters Tab)

    Define Data Visualization Wizard: Parameters Tab
  9. Click Save.
    The new data visualization is added to the page, displaying the data retrieved from the selected data source in the selected visualization template.

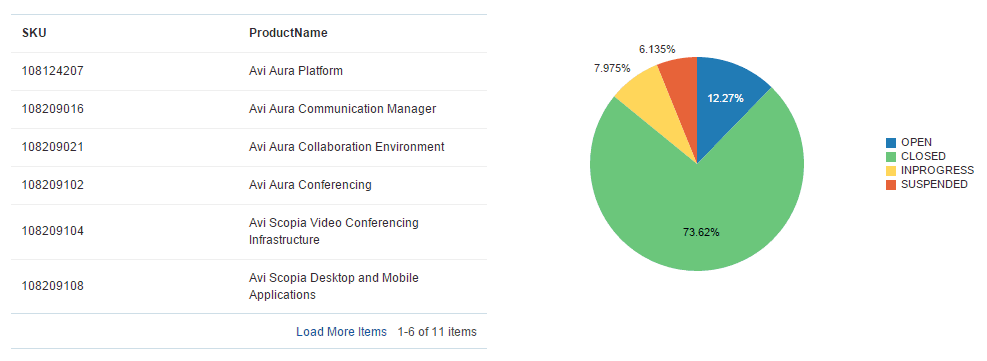
    Figure 23-10 shows an example for List View and Pie Chart built-in templates.

    Figure 23-10 Data Visualization on a Portal Page

    Data Visualization on a Portal Page

Deleting a Data Visualization

To delete a data visualization:
  1. Open the page that includes the data visualization in the page editor.

    For more information, see Opening a Page in the Page Editor.

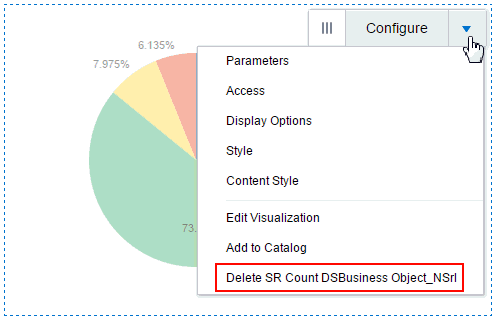
  2. Select the data visualization on the page, then click the View Actions menu and select Delete (Figure 23-11).

    Figure 23-11 Deleting a Data Visualization

    View Actions menu on a Data Visualization

Managing Data Visualizations

The Assets page provides limited options for managing data visualizations. You cannot edit, copy, or delete a data visualization from the Assets page. To make changes to the data visualization, you can edit the page and click Configure on the Data Presenter Visualization component (see Configuring a Data Visualization). ,

The following options are available on the Assets page to enable you to manage Data Presenter Visualization:

  • Upload—You can upload an archive file that contains a data visualization.

    For more information, see Uploading an Asset.

  • Download—You can download a data visualization into an archive file.

    For more information, see Downloading an Asset.

  • Actions

    • Edit Source—You can directly edit the source code of a data visualization on the Taskflow Definition, Fragment, and Page Definition tabs. Editing the source code is not recommended unless you are making a minor edit.

    • Show Properties—Each data visualization has an associated Show Properties dialog that summarizes useful information about it.

      For more information, see Viewing Information About an Asset.

    • Edit Properties—Each data visualization has certain properties associated with it that control how it is displayed in the portal. You can edit these properties through the Edit Properties dialog.

      For more information, see Setting Properties on an Asset.

  • Available—You can control whether or not a data visualization is available for use in a portal by selecting or deselecting this check box.

    For more information, see Showing and Hiding Assets.

Troubleshooting a Data Visualization

While working with data visualizations, you might need to troubleshoot various issues if the data is not rendered as required.

Text Not Aligned in the List View Template

If you use a SQL data source that selects a column that has a long text value with no spaces, the output does not wrap and appears misaligned

Solution: Add spaces in the source data.

Template or Data Changes Not Shown in Data Visualization

If changes are made to a custom visualization template or the structure of data retrieved from the data source that is selected in a data visualization, the data visualization does not automatically update with the changes.

Solution: Configure a new data visualization, selecting the updated template or data source.

REST Data Source Changes Not Shown in Data Visualization

If the underlying data selected by a REST data source changes, the changes are not reflected in the data visualization on the page.

Solution: To update the data visualization with changes to the data selected by the REST data source, exist the wizard and go to the Assets page of the portal to edit the data source (see Editing a REST Data Source), where you can select Refresh Schema to refresh the data source and the associated business object with changes such as added, deleted, or renamed attributes. For more significant structural changes, you will need to re-create the data source and any data visualizations where it is used.

Parameters Lost After Modifying Resource Path URL

If you modify the Resource Path URL in the Define Data Visualization wizard, the list of data source parameters will be refreshed, losing any parameters you may have specified earlier.

Solution: Respecify the required data source parameters in the Define Data Visualization wizard.

Expected Visualization Templates Not Shown for Selection

The templates available for selection in the Define Data Visualization wizard do not include all expected templates, such as Table and List.

Explanation: When you provide the Resource Path URL, WebCenter Portal creates the data source based on the data returned by the URL. If the URL returns only a single record at this time (possibly due to parameter values or limited data currently available), then WebCenter Portal creates the data source with the assumption that a single record will always be returned. In this case, the wizard shows only the Form template for selection, since this template is appropriate for presenting a single data record. It does not show the Table or List templates for selection, because these templates are appropriate for repeating records of data.

Solution: If you know that the data retrieved by the data source may be repeating and you want to select the List or Table templates, then the Resource Path URL that you specify must return repeating data at the time that the data source is created. Alternatively, you can create a data source on the Assets page (see Creating a REST Data Source), and provide a Response Payload that contains repeating data. Then, if you select that data source, the wizard will present all appropriate templates for selection, including List and Table.

New visualization Template Does Not Display After Selection

If you select a custom visualization template that was just published while you are in the page editor configuring the data visualization, you may encounter an error.

Solution: Do not enter the page editor until after the custom visualization template is published.

Link URL Does Not Link to Target

When you define an Output Format of Link for retrieved data, the link does not display its target when clicked in the data visualization.

Solution:  Specify a full URL (beginning with http://) or a URL relative to the portal’s web address.