The software described in this documentation is either no longer supported or is in extended support.
Oracle recommends that you upgrade to a current supported release.
This chapter provides introductory information about Grafana, and contains information about the components in Grafana that are used to monitor and visualize the metrics that are stored in a time-series database.
Grafana is an open-source platform that you can use to monitor the performance of your Kubernetes cluster. It contains dashboards that allow you to visualize the metrics of the cluster that are gathered and stored in an application such as Prometheus that records real-time metrics in a time-series database.
Grafana is a visualization tool for time-series data stored in a database. Time-series data is a sequence of values ordered by time. It measures how these values change over time. Examples of time-series data include self-driving cars collecting information about their local environments continually, homes monitoring themselves to regulate temperature or identify intruders, or a police department tracking its vehicles for efficiency purposes.
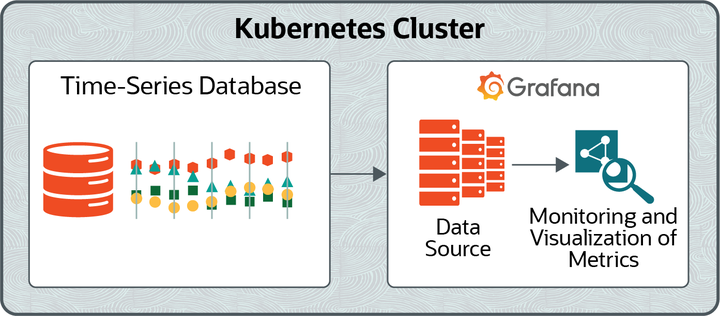
You use a data source to integrate Grafana with a time-series database such as Prometheus. A data source is Grafana's link to this type of database. By using a data source for Prometheus in Grafana, Grafana can retrieve, analyze, monitor, and visualize the metrics that are stored in a Prometheus time-series database.
The following architectural diagram illustrates how Grafana can use a data source to integrate with a time-series database such as Prometheus. As a result, Grafana can monitor and visualize the metrics that are stored in the database.


