The software described in this documentation is either no longer supported or is in extended support.
Oracle recommends that you upgrade to a current supported release.
Chapter 1 Introduction to Monitoring and Visualization
This chapter provides introductory information about Grafana, and contains information about the components in Grafana that are used to monitor and visualize the metrics that are stored in a time-series database.
1.1 What Is Grafana?
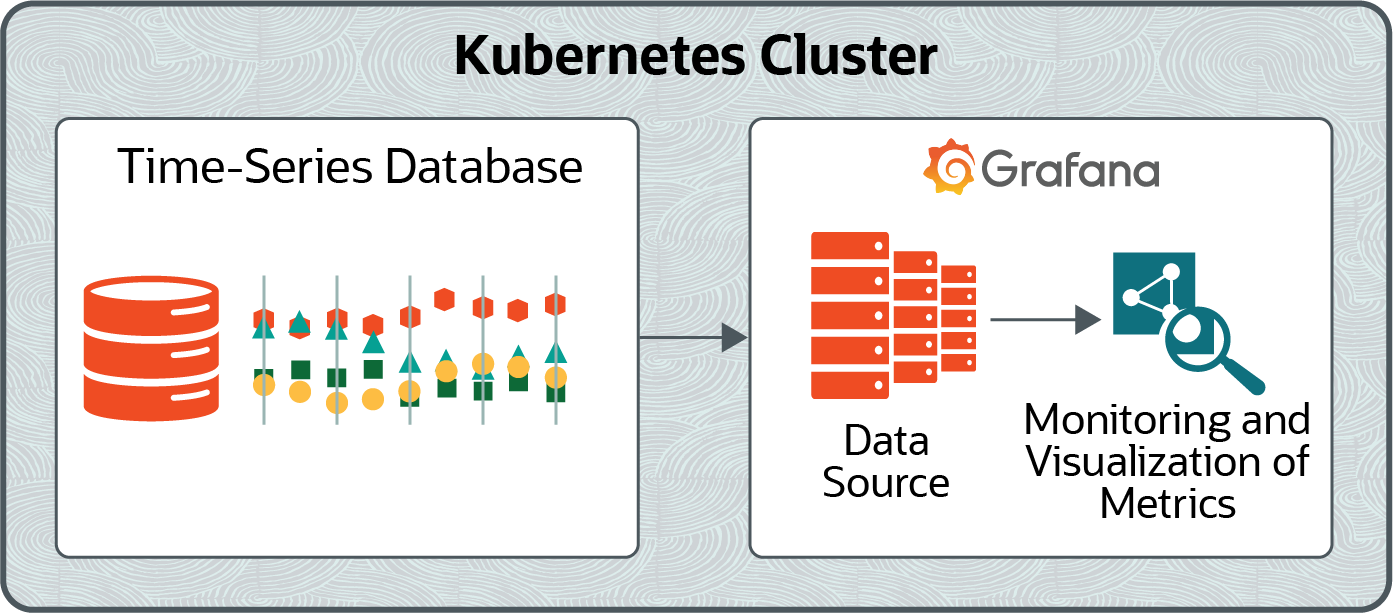
Grafana is an open-source platform that you can use to monitor the performance of your Kubernetes cluster. It contains dashboards that allow you to visualize the metrics of the cluster that are gathered and stored in an application such as Prometheus that records real-time metrics in a time-series database.
Grafana is a visualization tool for time-series data stored in a database. Time-series data is a sequence of values ordered by time. It measures how these values change over time. Examples of time-series data include self-driving cars collecting information about their local environments continually, homes monitoring themselves to regulate temperature or identify intruders, or a police department tracking its vehicles for efficiency purposes.
You use a data source to integrate Grafana with a time-series database such as Prometheus. A data source is Grafana's link to this type of database. By using a data source for Prometheus in Grafana, Grafana can retrieve, analyze, monitor, and visualize the metrics that are stored in a Prometheus time-series database.
The following architectural diagram illustrates how Grafana can use a data source to integrate with a time-series database such as Prometheus. As a result, Grafana can monitor and visualize the metrics that are stored in the database.
1.2 About Grafana
Grafana is based on a stable release of the upstream Grafana project. Differences between Oracle versions of the software and upstream releases are limited to Oracle specific fixes and patches for specific bugs.
For upstream Grafana documentation, see the upstream documentation at:
For more information about Grafana, see the upstream documentation at:
1.3 Grafana Components
This section contains information about the components in Grafana that are used to monitor and visualize the metrics that are stored in a Prometheus database.
1.3.1 Data Source
Data sources are Grafana's links to the different storage databases that Grafana supports. Grafana contains out-of-the-box support to connect to many time-series databases (including Prometheus) that you can use to monitor and visualize the metrics in your Oracle Cloud Native Environment. Grafana refers to a connection to this type of database as a data source.
By adding a data source for a time-series database in Grafana, Grafana can retrieve, analyze, monitor, and visualize the metrics that are stored in the database.
1.3.2 Query Editor
Grafana has a query editor that exposes the capabilities of your data source and allows you to query the metrics that it contains. Grafana provides a custom query editor for each data source, including the data source used to integrate Grafana with Prometheus. You can use the query editor to structure queries that allow you to visualize the metrics that are stored in the Prometheus database.
1.3.3 Panel
The panel is the main element in Grafana used to visualize metrics from a time-series database such as Prometheus. Each type of panel has its own query editor that allows you to fine-tune the data that you want to visualize.
There are several panel types, including Graph, Singlestat, Table, Text, and Dashboard List. In this book, you use the Graph panel. This is the main panel type in Grafana and it provides a rich set of graphing options.
For more information about the other panel types, see the upstream documentation at:
https://grafana.com/docs/grafana/latest/features/panels/panels/
1.3.4 Dashboard
A dashboard is a grouping of panels prearranged into rows. A row is the divider between panels.
1.3.5 User
A user has an account in Grafana. A user is granted permissions in Grafana based on the following roles:
-
Admin: An admin has superuser permissions in Grafana, and can do everything, including adding and editing data sources, generating queries for the data sources, and creating and modifying dashboards.
-
Editor: An editor has limited permissions in Grafana. Although an editor can create and modify dashboards, they cannot create or edit data sources, or generate queries for the data sources.
-
Viewer: A viewer has read-only access to the components in Grafana. For example, a viewer can view data sources and dashboards, but cannot modify them.
In this book, you access Grafana as an Admin. For more information about the Admin, Editor, and Viewer roles, see the upstream documentation at:
https://grafana.com/docs/grafana/latest/permissions/organization_roles/