Per-CPU Data for Aggregations
DTrace offers the option to gather per-CPU data for aggregations. This capability can be useful when the combined aggregation data does not provide sufficient resolution. For example, the intrstat command uses per-CPU aggregation data to report statistics about CPUs that handle interrupts for each device. You can enable the collection of per-CPU aggregation data by setting the aggpercpu option.
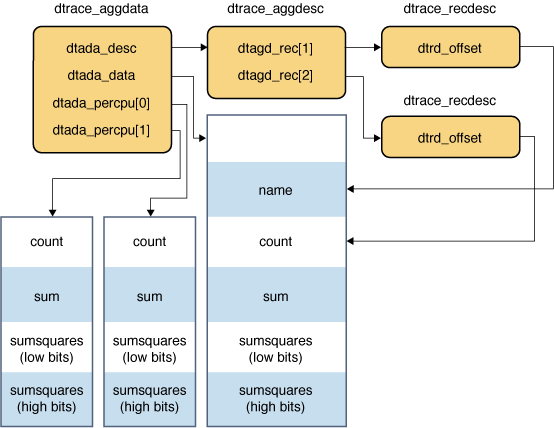
When per-CPU aggregation data is collected, the dtada_percpu array in the dtrace_aggdata structure references the location to store the collected data. The dtada_data member of that structure references the location to store the total aggregation data. The following figure shows the per-CPU aggregation.
Using Per-CPU Data for Aggregations

You do not need an offset to index these buffers because the first two fields in the dtada_data buffer are not duplicated in the per-CPU buffers. You can add the following code to the end of the Using the walk() Function, to examine the data in the per-CPU buffers.
if (!data->dtada_percpu)
        fatal("No per-cpu data\n");

for (i = 0; i < g_max_cpus; i++) {
        if (!g_present[i])
                continue;

        count = *((uint64_t *)(data->dtada_percpu[i]) + 0);
        sum = *((uint64_t *)(data->dtada_percpu[i]) + 1);
        sumsquares = *((uint64_t *)(data->dtada_percpu[i]) + 2);

        avg = (double)sum / count;
        avgsquares = (double)sumsquares / count;
        stddev = sqrt (avgsquares - avg * avg);

        if (count)
                printf("%11s %2d %10lu %17.3f %17.3f\n", "CPU", i,
                    count, avg, stddev);
        else
                printf("%11s %2d %10lu %17s %17s\n", "CPU", i,
                    count, "-", "-");
}
printf("\n");
The variable g_max_cpus is set to make a call to the sysconf() function. Because the value might be larger than the number of CPUs present, the entries in the g_present array are set to indicate whether a particular CPU is present. The function iterates over the set of possible CPU IDs. If a CPU is present, the function extracts and processes this data from the per-CPU buffer.
When this version of the consumer is run by using a D program to measure the standard deviation of system call latency, the output displays the overall values and the per-CPU breakdowns; as shown in the following example.
NAME          COUNT          AVG         STDDEV
          brk             30     3811.167       3460.861
        CPU 0             16     3350.438       2969.729
        CPU 1             14     4337.714       3881.644

clock_gettime              3     1694.000        501.488
        CPU 0              3     1694.000        501.488
        CPU 1              0            -              -

        close              5     5091.800        1613.886
        CPU 0              0            -               -
        CPU 1              5     5091.800        1613.886

       fchmod              1     3994.000           0.000
        CPU 0              0            -               -
        CPU 1              1     3994.000           0.000

        fcntl              3     1445.333         482.400
        CPU 0              0            -               -
        CPU 1              3     1445.333         482.400

         fsat              3     31520.000        6722.756
        CPU 0              0             -               -
        CPU 1              3     31520.000        6722.756

      fstat64              3      2520.667         537.064
        CPU 0              0             -               -
        CPU 1              3      2520.667         537.064