Employ anomaly detection for managing assets and predictive maintenance
Anomaly detection is the identification of rare items, events, or observations in data that greatly differ from expectations. This has uses in many industries for asset monitoring and maintenance.
Anomaly Detection Service helps you detect anomalies in time series data without the need for statisticians or machine learning experts. It provides prebuilt algorithms, and it addresses data issues automatically. It is a cloud-native service accessible over REST APIs and can connect to many data sources. The OCI Console, CLI, and SDK make it easy for use in end-to-end solutions.
In this reference architecture we highlight how Oracle Cloud Infrastructure Anomaly Detection Service working with other OCI data services can help with the following use cases:
- Asset Management
- Asset management focuses on optimal operation of assets, ensuring that operational metrics and KPIs are met such as throughput/output, scrap, quality, safety, and yield.
- Predictive Maintenance
- Predictive maintenance is about cost avoidance and minimizing operational disruptions that increase expenses such as scheduling additional shifts, paying overtime, freight expediting, and other costs.
- Smart Manufacturing
- Smart manufacturing involves finding ways to improve operational efficiencies to increase revenues and profits. Anomaly Detection can discover patterns to predict yield and product defects early in the manufacturing cycle, and trace products to analyze impacts, thereby increasing throughput and output, improving quality, and reducing scrap.
Architecture
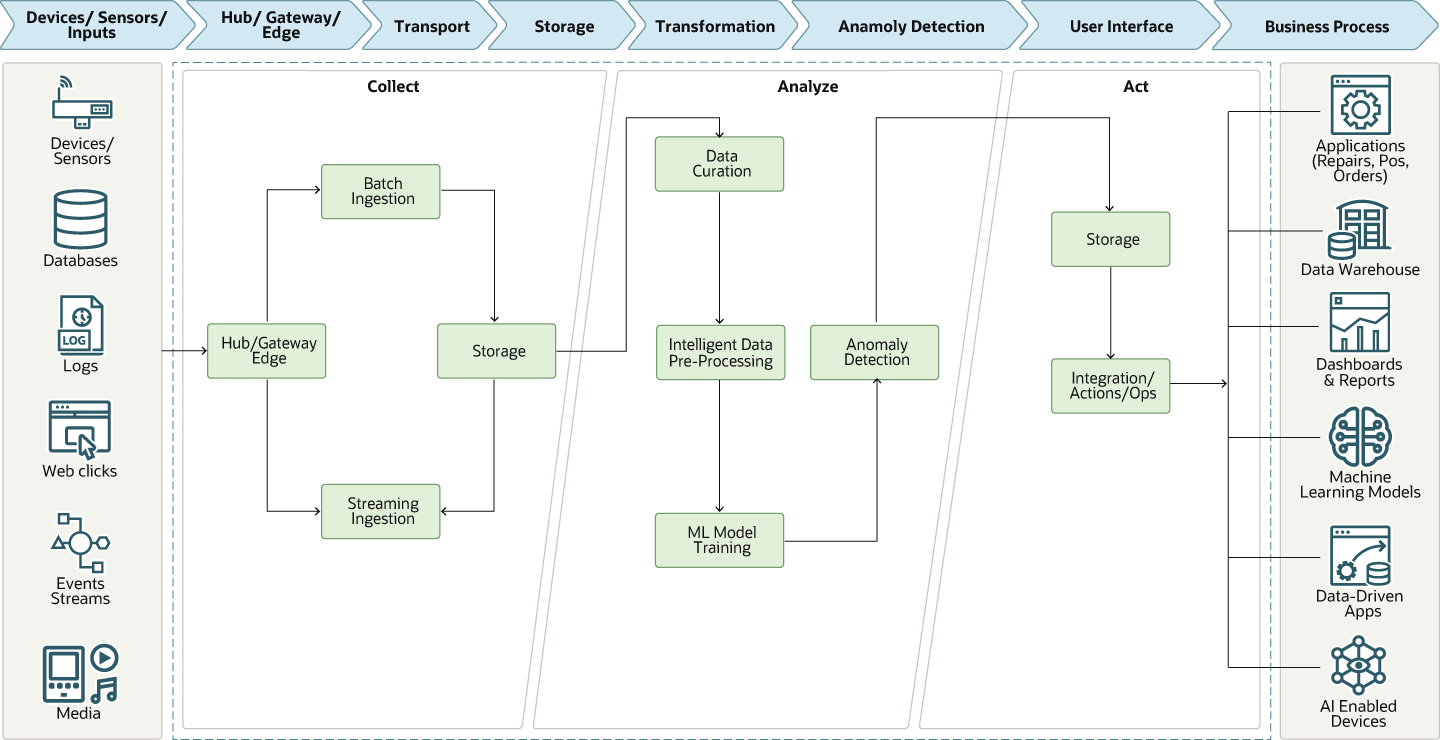
This reference architecture has three primary phases: Collect, Analyze, and Act. Within these phases are eight technology stages.
The following diagram illustrates this reference architecture.

Description of the illustration architecture-anomaly-detection.png
The architecture has the following components:
- Collect
- The collect phase has the following stages:
- Devices, sensors, and inputs that generate the data.
- A hub, gateway, or edge that collects the data.
- Data transport for processing by batch, streaming, interval, real-time, or other methods.
- Storage of data for analysis, management, and future use.
- Analyze
-
- Curation
Involves managing data that makes it more useful for users engaging in data discovery and analysis. This includes the collection of data from diverse sources, and integrating it into repositories. Data curation includes data authentication, archiving, management, preservation retrieval, and representation
- Pre-Processing
Involves fixing the typical problems associated with IoT time-series data collection such as mis-matched clock synchronization, missing values, and low signal-to-noise ratio
- Model Training
The algorithms are trained on sample data that are complete and free of anomalies. This creates a model against which live data are compared.
- Anomaly Detection
Machine Learning algorithms for identifying patterns and anomalies in data.
Anomaly Detection Service is a set of algorithms that can mine large amounts of data and look for patterns and anomalies. It is a combination of three techniques:
- Intelligent Data Pre-Processing (IDP):
These are patented algorithms that are designed to fix typical problems associated with the collection of IoT time-series sensor data. They are automatically applied by the service as required. Examples of IDP techniques include:
- Analytical Resampling Process (ARP)
ARP helps to deal with different sampling rates (clock mismatch issues). It uses interpolation-based up-sampling/down-sampling methods to generate uniform sampling intervals for all telemetry time series.
- Missing Value Imputation (MVI)
MVI helps to intelligently impute missing values. It uses a combination of interpolation and MSET estimates to intelligently populate the blind spots (missing values).
- UnQuantization (UnQ)
UnQ helps to convert a low-resolution signal to higher resolution
- Analytical Resampling Process (ARP)
- Multivariate State Estimation Technique (MSET)
This algorithm is used for learning the relationship between multiple signals in a time series dataset to come up with intelligent estimates.
- Sequential Probability Ratio Test (SPRT)
This test uses the data from MSET to provide early detection of anomalies.
- Intelligent Data Pre-Processing (IDP):
- Curation
- Act
-
- User Interface
For presenting results in easy-to-understand applets, dashboards, graphs, charts for people with roles such as Operations, Management, or Data Scientists.
- Business Process
Processes for incorporating the results into standard business transaction applications to trigger an action such as creating a service request, purchase order, sales order, or remote firmware update. Integrations with other systems and tools can minimize errors, improve productivity, and speed execution.
- User Interface
Recommendations
Your requirements might differ from the architecture described here. Use the following recommendations as a starting point.
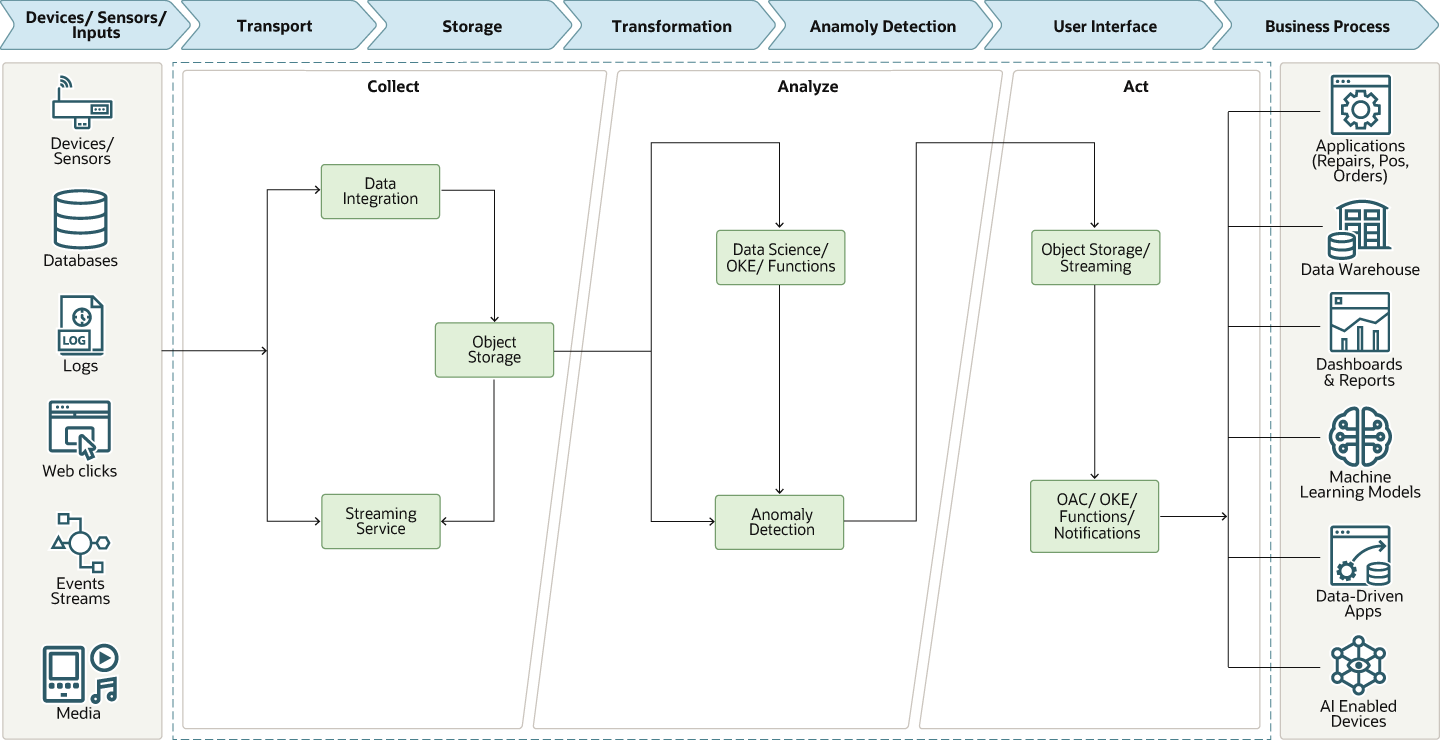
The following diagram shows some of the Oracle services you can use in this architecture.

Description of the illustration solution-anomaly-detection.png
- Gateway
This can be a custom hub designed for specific sensor data collection. It might also be a database such as Oracle Autonomous Data Warehouse, Oracle NoSQL, or some other database.
- Transport
Data Integration: Use Oracle Cloud Infrastructure Data Integration for migrating all history data offline to Object Storage. Once data is transferred to Object Storage, it can be accessed by all OCI services.
Streaming: Use Oracle Cloud Infrastructure Streaming for real time ingestion of events and data that can be consumed or stored in Object Storage.
- Object Storage
Oracle Cloud Infrastructure Object Storage is the default storage in this architecture. All data should be stored in Object Storage from all services. All structured, semi-structured, and unstructured data can be stored in Object Storage.
- UI and Business Process Integration
- Oracle
Analytics Cloud
Analytics Cloud can be used to build dashboards, applets, visualizations, reports, and other analytics.
- Oracle Cloud Infrastructure Data Science
This can be used for reading data from different sources to create visualizations by using Python libraries in a notebook session.
- Oracle Cloud Infrastructure Data
Integration
This can be used to integrate the Anomaly Detection solution into business applications for automated workflow processing, providing notifications to personnel, and for many other use cases.
- Oracle
Analytics Cloud
Considerations
When building your anomaly detection solution, consider these implementation options.
| Guidance | Recommended | Other Options | Rationale |
|---|---|---|---|
| Sensors | Start with sensors designed and already installed on the equipment. Non-invasive sensors can be added at any time to provide additional monitoring capabilities. | The Oracle Partner Network has many integrators and re-sellers by industry and region that sell sensors and can assist in deploying some or all of an anomaly detection solution. | Adding traditional sensors to currently installed equipment is usually difficult. New sensors such as Vibration and Acoustic Resonance sensors (VARS) are inexpensive and easy to install. Consider adding these types of sensors instead of traditional sensors. |
| Transport | Most anomaly detection use cases involving asset management, predictive maintenance, or smart manufacturing do not need real-time monitoring. Batch transfer of data every few minutes is an easier architecture to design and deploy. Also, when evaluating anomaly detection solutions, use an historical file of time-series sensor data. |
|
Depending on the type, number and sampling rates of sensors, the architecture can vary significantly. Some use cases can batch send data for detection, others are near real-time detection at the edge, perhaps in combination with a public cloud. Other use cases require real-time detection at the edge for safety, security, notification, unavailable or unreliable communications capabilities, or other reasons. This must be carefully evaluated and architected in order to arrive at a successful solution. |
| Storage | Object Storage is the preferred method of storage for the Anomaly Detection Service | Autonomous Data Warehouse can be used for storing structured data for faster retrieval. You can write data to Data Warehouse from Data Integration, Data Flow or from any other service. Data Warehouse is a serving and presentation store as well. | Object Storage is an internet-scale, high-performance storage platform that offers reliable and cost-efficient data durability. |
| Anomaly Detection | To ensure the best performance with the Anomaly Detection Service, make sure to train the ADS model using non-anomalous data. This requires removing the anomalies from an historical data file so that it represents a "golden image" of an ideal equipment operation. | If anomalies are not removed from the training model data, those that remain will be assumed as optimized, normal operation. Therefore, they will not be identified as anomalies since the model was trained with them in place | |
| UI | Use Oracle Analytics Cloud to create the user interfaces to address what and how to correct the detected situation. The notifications can be visualizations, workflows, applets, dashboards, etc. | Once an anomaly is detected, it is important to know what action to take to correct the situation. There might be many individuals who must be notified. Developing the appropriate user interface for those individuals will have a major impact on the success of your anomaly detection use case. | |
| Business Process Integration | Use Oracle Integration Cloud to connect your Anomaly Detection solution to back-office applications that could automate the response to a detected anomaly. |
Connecting your anomaly detection solution to your back-office applications can improve the speed and accuracy of your response in addressing the anomaly. Based on the type and severity of the anomaly, here are some examples of how this integration might be of significant value:
|
More Information
- Documentation homepage for the Anomaly Detection service. The homepage includes links to the API docs, SDK, community forums, and Oracle Support.
- Best practices framework for Oracle Cloud Infrastructure