Learn About Publishing GPU Instance Metrics to Oracle Cloud Infrastructure Monitoring
Despite that limitation, if your computer uses an NVIDIA GPU, it's possible to easily publish custom metrics to the Monitoring service. This solution shows how to use a Linux Shell script or a Windows PowerShell script to publish GPU temperature, GPU utilization, and GPU memory utilization metrics from OCI GPU instances to Oracle Cloud Infrastructure Monitoring. In addition to these metrics, the scripts you will be developing in the course of this exercise can be easily modified to publish other GPU-specific data.
About Oracle Cloud Infrastructure Monitoring
Oracle Cloud Infrastructure Monitoring enables you to actively and passively monitor your cloud resources using the Metrics and Alarms features.
- Availability and latency
- Application uptime and downtime
- Completed transactions
- Failed and successful operations
- Key performance indicators (KPIs), such as sales and engagement quantifiers
Architecture
For Linux images, the solution is a shell script that is run by a cron job automatically. For Windows images, the solution is a PowerShell script that is run by a scheduled task automatically.
- Query metrics from the GPU instance by using NVIDIA-smi.
- Convert the metrics gathered from NVIDIA-smi to valid JSON.
- Publish the JSON to the Monitoring service by using the CLI.

Description of the illustration publish_gpu_instance_to_oci_monitoring.png
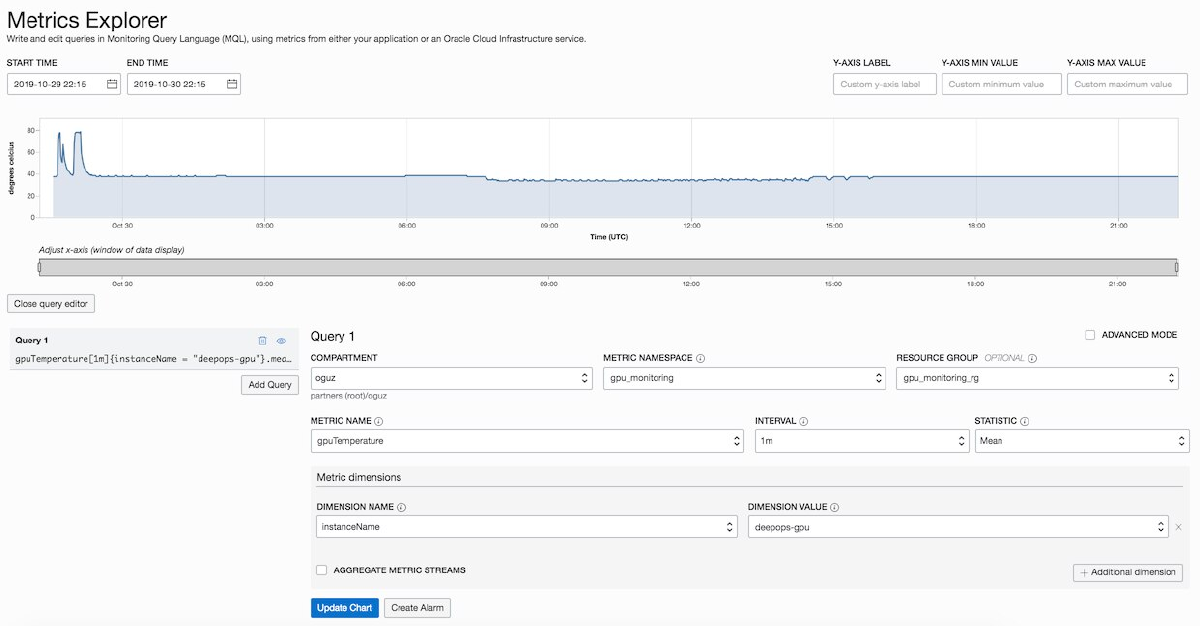
After the setup is completed, the metrics become visible in Oracle Cloud Infrastructure
Monitoring. The following image shows the GPU temperature for a specific time frame:
Description of the illustration metrics_explorer.png
Considerations for Publishing GPU Instance Metrics to Oracle Cloud Infrastructure Monitoring
Before starting this solution, you should consider these important factors:
- This solution applies only to NVIDIA graphics processing units.
- O/S Versions:
- For Linux images, the solution is a shell script that is run by a cron job automatically. This solution supports these Linux releases:
- Oracle Linux 7
- Ubuntu 16.04
- Ubuntu 18.04
- For Windows images, the solution is a PowerShell script that is run by a scheduled task automatically. This solution supports these releases:
- Windows Server 2012 R2
- Windows Server 2016
- Where necessary, this solution presents separate instructions based on your specific operating system. Ensure that you are following the correct instructions for your operating system.
- For Linux images, the solution is a shell script that is run by a cron job automatically. This solution supports these Linux releases:
- IAM Policy: The script publishes the metrics to the same compartment as the GPU instance being monitored by default. You probably have the necessary IAM policy already configured for your user. If you plan to use a separate compartment for publishing the metrics, or if you get a message that you don’t have permission or are unauthorized, check with your tenancy administrator.
- User interface: This solution employs command line interfaces (CLI) to launch the process. It uses uses the NVIDIA System Management Interface (NVIDIA-smi) command line utility to gather metrics from the GPUs and the Oracle Cloud Infrastructure CLI to upload the metrics to Oracle Cloud Infrastructure Monitoring. Further information for these interfaces follow.
About NVIDIA-smi
This solution uses the NVIDIA System Management Interface (NVIDIA-smi) command line utility to gather metrics from the GPUs, and then uses the Oracle Cloud Infrastructure command line interface (CLI) to publish these metrics to the Monitoring service.
NVIDIA-smi ships with NVIDIA GPU display drivers. GPU shapes with Oracle Linux 7 images come with the GPU drivers installed. GPU shapes with Ubuntu 16.04, Ubuntu 18.04, Windows Server 2012 R2, and Windows Server 2016 images are supported, but you must install the appropriate GPU drivers from NVIDIA.