Analyze Database I/O Activity
View the current I/O activity, compare I/O activity across databases, and forecast future I/O needs to plan your resources for a later time period.
Analyze I/O Trend Over Time
The I/O section under the Overview tab displays the current trend of disk I/O activity across the selected databases for the specified time period.
Alternatively, click the I/O tab in the navigation pane to view the current trend of I/O activity in terms of MB units, during a specified time and forecast future activity.
Compare I/O Activity Between Databases
The IO breakdown by individual databases chart lets you compare the I/O activity of your different databases.
The volume and percentage changes in the I/O activity are represented visually through the size and color of the cells, respectively. Cells that are larger have greater I/O activity than smaller cells. The largest cell would be that of the database with the highest I/O activity. The color of the cells is determined by the percentage change in the I/O activity during the specified time period.
Analyze Current I/O Trend and Forecast Activity
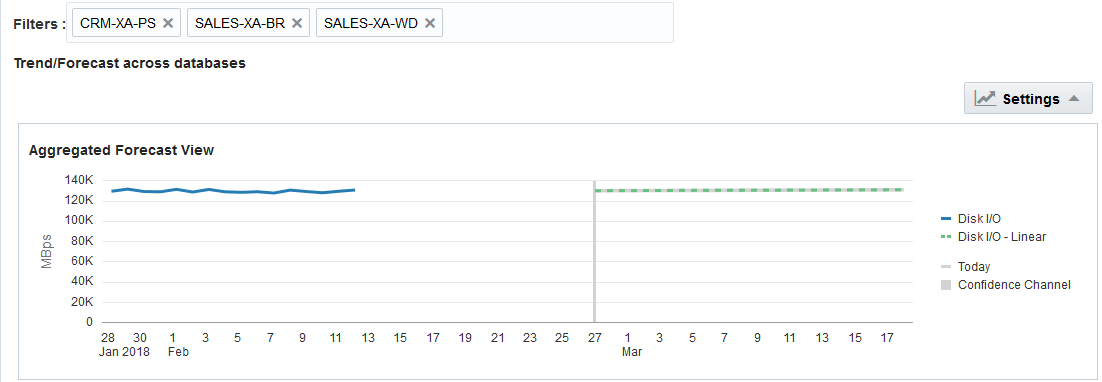
From the Aggregated Forecast View chart, you can view the current trend of I/O activity, and use this trend to forecast future I/O activity.
For the Database Resource Analytics application to forecast your resource utilization for a year, there must be at least 13 months of data stored in the Oracle IT Analytics warehouse. The forecast value is more accurate when there’s more data stored in theOracle IT Analytics warehouse.
You can use the current and forecast I/O activity to plan your database capacity.
For example, if the forecast I/O activity is at a high level, then you must ensure that you have sufficient resources to support the elevated I/O activity.

