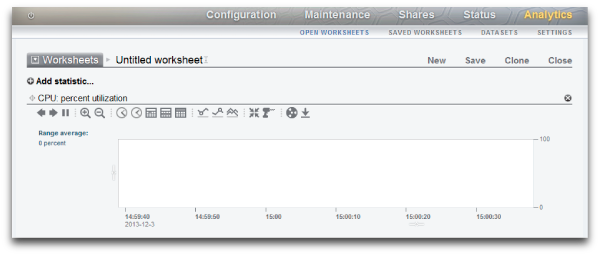
CPU: Percent Utilization
This statistic shows the average utilization of the Oracle ZFS Storage Appliance CPUs. A CPU may be a core on a socket or a hardware thread; the number and type can be seen under analytics interface. For example, a system might have four sockets of quad-core CPUs, meaning there are 16 CPUs available to Oracle ZFS Storage Appliance. The utilization shown by this statistic is the average across all CPUs.

Oracle ZFS Storage Appliance CPUs can reach 100% utilization, which might or might not be a problem. For some performance tests, the appliance is deliberately driven to 100% CPU utilization to measure it at peak performance.
Example
The figure in section CPU: Percent Utilization shows CPU: Percent utilization broken down by CPU mode, while Oracle ZFS Storage Appliance served over 2 Gbytes/second of cached data over NFSv3.
An average of 82% utilization suggests that there could be more headroom available, and that appliance might be able to serve more than 2 Gbytes/second (it can). (The breakdowns only add up to 81%; the extra 1% is due to rounding.)
The high level of CPU utilization means that overall latency of NFS operations might increase, which can be measured by Protocol NFS operations broken down by latency, as operations might be waiting for CPU resources more often.
When to Check CPU Percent Utilization
You can check CPU percent utilization when investigating system bottlenecks. You can also check this statistic when enabling features that consume CPU, such as compression, to gauge the CPU cost of that feature.
CPU: Percent Utilization Breakdowns
The available breakdowns of CPU percent utilization are:
Table 5-9 Breakdowns of Percent Utilization
| Breakdown | Description |
|---|---|
|
CPU mode |
Either user or kernel; see the following CPU modes table. |
|
CPU identifier |
Numeric operating system identifier of the CPU. |
|
application name |
Name of the application which is on-CPU. |
|
process identifier |
Operating system process ID (PID). |
|
user name |
Name of the user who owns the process or thread that is consuming CPU. |
The CPU modes are:
Table 5-10 CPU Modes
| CPU Mode | Description |
|---|---|
|
user |
This is a user-land process. The most common user-land process consuming CPU is |
|
kernel |
This is a kernel-based thread that is consuming CPU. Many of the Oracle ZFS Storage Appliance services are kernel-based, such as NFS and SMB. |
Further Analysis
A problem with this CPU utilization average is that it can hide issues when a single CPU is at 100% utilization, which might happen if a single software thread is saturated with work. Use the Advanced Analytic CPUs broken down by percent utilization, which represents utilization as a heat map of CPUs, allowing a single CPU at 100% to be easily identified.
Details
CPU utilization represents the time spent processing CPU instructions in user and kernel code that are not part of the idle thread. Instruction time includes stall cycles on the memory bus, so high utilization can be caused by the I/O movement of data.