3 Filtering Variants and Starting Reports
This section describes the tasks you can perform with reports. It includes the following sections:
3.1 Patient Overview
You can view information about the specimen, order and data files corresponding to running genomic tests or molecular data for a given patient. Only molecular pathologists and researchers roles have access to this feature.
To display the overview, click the arrow next to the patient name on the top left corner.

Description of the illustration ''fig15.gif''
The following information is displayed:
-
Order (Lab) - Order ID and Lab that the order is coming from
-
Clinical Diagnosis - The diagnosis linked to the order, can be more than one.
-
Ordering Physician - The physician who placed the order
-
Order Date - The date the order was placed
-
Specimen ID (Lab) - Specimen number and vendor number
-
Collection Date - When specimen was collected
-
Specimen Type - The type of specimen, for example, blood tissue
-
Anatomical Site - The site from where the specimen was taken, for example, liver.
-
Histopathology Diagnosis - The diagnosis associated with specimen when returned from the pathology lab. This may or may not be same as the one associated with order, could be multiple.
-
Estimated Tumor Percentage - The percentage of tumor estimated to be in tissue, for example, 10-30, >20, numeric values 0 to 100
-
Test - The test(s) performed and dates each test was performed
-
Test Source - Test source, from ODB reference part of the test
-
Test Method - The method associated with the test in the ODB reference portion of the model
-
Result Files - Sequencing files produced as a result of the test
The View Patient link on the bottom right navigates to the Patient Viewer page.

Description of the illustration ''fig16.gif''
3.2 Selecting Data Files
Perform the following steps to add data files to your report:
-
Depending on which page you have navigated from, click Create new report/View files as shown in Figure 3-1 or Add files as shown in Figure 3-2.
Figure 3-2 Adding Files to an Existing Order

Description of ''Figure 3-2 Adding Files to an Existing Order''
The following details are displayed for each file:
-
File ID - The file ID from Omics Data Bank
-
Date Loaded - Date on which the sequencing file was loaded
-
Order (Lab) - The order number associated with clinician's order
-
Order Date - The date when the clinician ordered the report
-
Test Name - The tests that have been ordered
-
Specimen (Lab) - Sample Identifier and the Lab the specimen was collected from
-
Anatomical Site - Anatomical site that the specimen came from, for example, Lung or Blood
-
DNA Assembly - The Assembly corresponding to results in the sequencing file
-
-
Select the files you want to add.
Note:
All files you select must have:-
Their results aligned to the same Assembly or Alignment version. Once you select a file, all files that are not associated with the selected specimen or not aligned to same Assembly are greyed out and cannot be selected.
-
Results corresponding to same (specimen, vendor) combination
However, the associated DNA annotation version can be different.

Description of the illustration ''fig8.gif''
To deselect a file, click the cross icon located next to it or you can deselect it in the previous step.
Note:
If a file being deselected has Annotated variants associated with it, a warning is displayed.If the report only has one file remaining and you try to delete it, you will be prompted to remove any annotated variant associated with the report. Only after removing the annotated variant can the file be deselected.

Description of the illustration ''fig11.gif''
-
-
Click Select.
3.3 Associating Diagnoses with Reports
All the diagnoses associated with a report are visible in the top right hand corner. When a report is created, the diagnosis from the Order is automatically associated with the report. If the report is not based on an Order, you can select the diagnosis and save the report. On opening the draft report again, you can view the saved diagnosis. You can also leave the diagnosis in a report blank.
To add or edit diagnoses, perform the following steps:
-
Click the pencil icon on the top right next to the diagnosis name.

Description of the illustration ''fig12.gif''
A drop-down list of diagnoses is displayed. Diagnoses for a candidate is based on the patient's clinical diagnosis history. The candidate diagnoses, coming from patient history or order is restricted to 5 days after the Order is placed. An admin user can change this period of time to be different number.

Description of the illustration ''fig13.gif''
-
You can search for a new diagnosis using the search box. Entries matching your input will be displayed.

Description of the illustration ''fig14.gif''
-
Select the diagnosis you want to add. You can select more than one diagnosis.
-
Click anywhere outside the panel to close it.
3.4 Filtering Variants
This section describes all the tasks associated with filtering variants. To navigate to the filter pane, perform the following steps:
-
Click a draft report to open it.
-
Click Back to Reporting on the bottom left. The Report View appears with the filter pane located on the left.
3.4.1 Filtering Criteria

Description of the illustration ''fig17.gif''
The filter pan consists of two sections:
-
Variant Metadata
-
Gene Panel - Name of the Genomic Test that was run to get the results for the patient, typically Panel Test. You can select multiple values.
The gene panel values are preselected based on the files selected from the Add files (Section 3.2),when creating a new report.
-
Variant Status - Specifies which variant types to consider, whether the variant should be known or novel. Default considers all variants. You can select multiple values.
-
Variant Type -The type of variant. You can select multiple values.
-
Variant Impact - Each variant type's impact on the resulting protein. You can select multiple values.
-
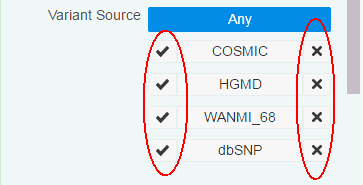
Variant Source - You can filter variants based on a custom knowledge base. For details, see Section 3.4.3. To include variants from a given source, click the check mark. To exclude variants from a given source, click the x mark.

Description of the illustration ''fig53.gif''
-
-
Variant Location
-
Gene - List of one or more genes. You can select multiple values. After you enter the first three character of the gene, the autocomplete feature is enabled and displays matching values.
-
Gene Set - User-defined collection of genes that you can reference anytime instead of having to build ad-hoc lists of genes each time. You can select multiple values. After you type the first character, the autocomplete feature displays matching values.
-
Pathway - Reference to a pathway stored on the reference side of the ODB model. This in turn corresponds to a list of genes that are to be used to compare their Intensity values. You can select multiple values. After you type the first character, the autocomplete feature displays matching values.
-
Genomic Position - Specify genomic location for the variants to occur in. You can enter values in the format chr#:from-to or chr#:from where 0 < from <= to
-
Region - Types of regions supported including Exome, 3' and 5' UTR, promoter region. If you select Gene, Gene Set, Pathway, or Genomic Position, the Region filter is enabled and prepopulated with Exome. You can remove it before applying the filter criteria.
-
Variant Identifier - Variant identifier which is a representation of the known variant through RS ID, Cosmic ID, or coding region variants through HGVS identifier. You can search for HGVS variant identifiers by entering the gene name and the autocomplete feature displays the matching IDs. You can select multiple values.
-
You can use the various options to view a set of variants for a report. The Apply button is enabled only after you select at least one criteria. Click Apply to view the filtered variants. The Apply button is enabled only if the filters applied are different from the previous search. The selected criteria will be displayed the next time you open the Filter pane.
Performance will degrade if you select a large set of genes—either by selecting multiple pathways, large gene-sets or many ad-hoc gene selections. The more genes selected the more likely it is that the query performance degrades, especially with large result datasets.
Note:
Filter criteria are not be saved with a Report. They will be reset when you log in again.3.4.1.1 Clearing Filter Criteria
You can clear the filtered criteria by clicking Clear. You will receive a confirmation asking you if you want to clear the criteria. Click Yes. Click Apply to apply your changes.
Figure 3-3 Confirmation to Clear Criteria

Description of ''Figure 3-3 Confirmation to Clear Criteria''
3.4.2 Tabular View of Variants
In the tabular view, you can select variants and then annotate them. Only 500 variants are displayed in the table. By default, filtered variants are sorted by Genomic Position. You can sort the columns either in ascending or descending order by clicking the sorting icons of the following columns:
-
HGVS Variant Id - Variant ID based on HGVS simple notation
-
Gene - The gene name
-
Position - The position on chromosome along with strand direction
-
Zygosity - Variant zygosity

Description of the illustration ''fig18.gif''
The Variants Found section denotes how many variants are displayed and how many are totally found. For example, 500/1000 Variants Found implies that 1000 variants were found but only 500 have been displayed in the table.
The Variants Annotated section denotes how many of the displayed variants have been annotated. Annotated variants have the following icon in the first column:

Description of the illustration ''fig54.gif''
Note:
A very small subset of variants may appear in multiple UI screens and reports to be associated with the placeholder record in the gene table with the name NO GENE.A NO GENE gene is not a regular coding gene and can be safely ignored when displayed, with any mapped variant assumed to be intergenic unless mapped to another valid gene region.
3.4.3 Filtering Variants Based on Custom Knowledge Bases
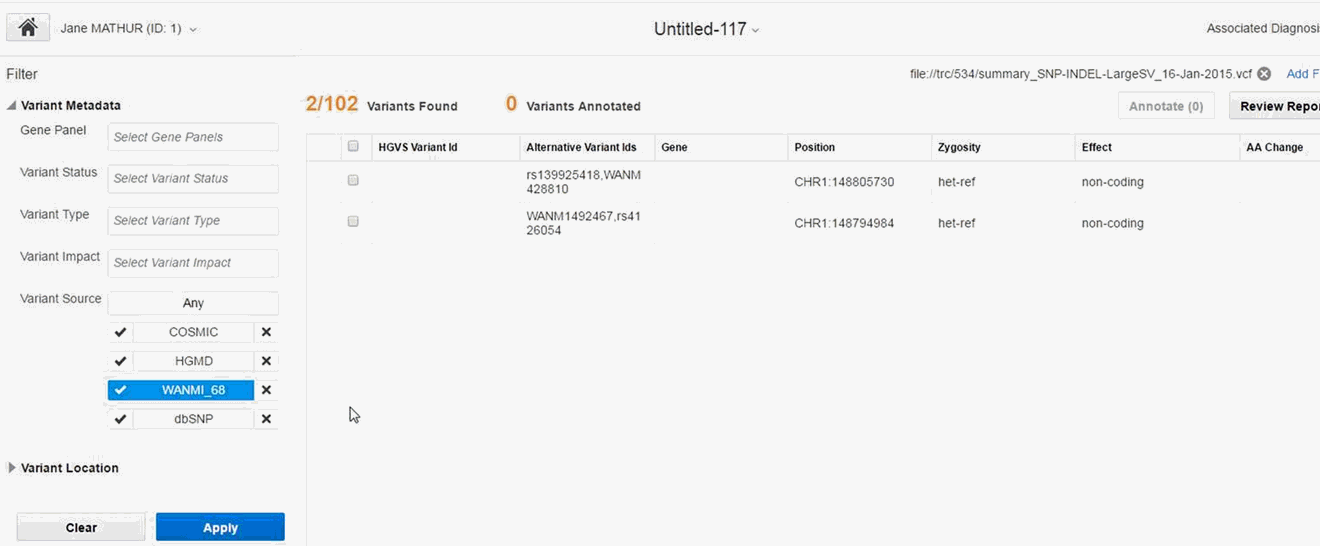
You can filter variants based on custom knowledge bases in OHPM. You can include criteria from custom variant sources while filtering variants.

Description of the illustration ''fig48.gif''
