You enter temporal data in the debugger by specifying change points for the base level attributes that you setting values for. A change point represents a value for an attribute applying from a specified date until the next change point (if there is one). To add a change point for an attribute in the debugger:
Select the attribute in the Data view or Decision view, right-click and select Set Value... (Alternatively, if the attribute is a base level attribute, you can just double-click the attribute.)
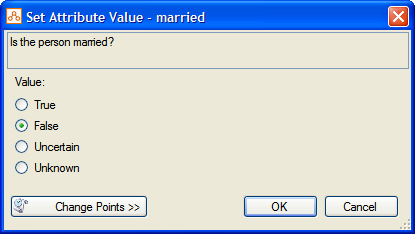
In the Set Attribute Value dialog box, specify the initial value for the attribute. This is the value that the attribute takes up until the first change point. (For the correct format to use when setting variable values, see Formatting of variable values.)
Select the Change Points button. This expands the dialog box so that you can add Change Points for the attribute.
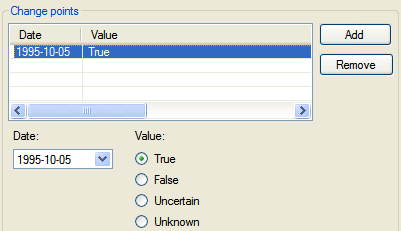
Click the Add button to add a new change point. A change point will be added. (By default this will have today's date and a value of unknown.)
From the Date field, select the desired date (or type a new date). Then select the check box for the Value that applies from that date.
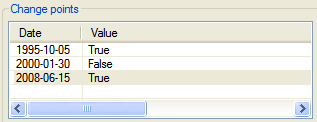
To add additional change points, repeat steps 4 and 5.
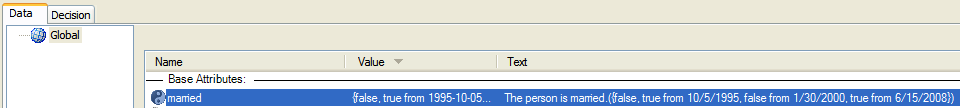
When you have created all the change points, click OK. In the Data view you can now see the values you set for the attribute.
To delete change points, select the desired row or rows in the Change points table (from the Set Attributes Value dialog) and click the Remove button.
Visualize temporal data
In the debugger, you may want to visualize on a timeline how an attribute's value changes, relative to other attribute's values. To do this:
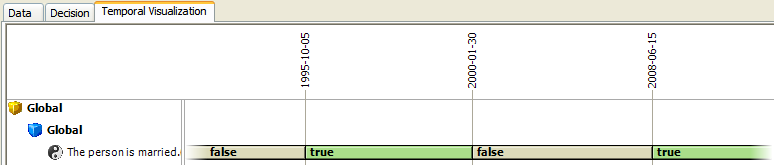
Select the attributes you are interested in the Data view or Decision view, right-clicking and selecting Show in Temporal Visualization.
Select the Temporal Visualization tab. The attributes and their values are displayed in a timeline.
There are three panes to this view:
The left hand pane shows the attributes, organized by entity. The attributes are labeled either by their name (public name if they have one, otherwise their model id) or by their text, as specified in the Temporal Options dialog box.
The right hand pane shows a timeline for each attribute's values. Non-boolean attributes are indicated with a blue timeline. Boolean attributes have a gray timeline where they have a False value and a green timeline where they have a True value.
The top pane has a date for every change point represented in the timelines below.
To remove an attribute from the Temporal Visualization view, select the attribute in the Data view, the Decision view or the Temporal Visualization view and deselect Show in Temporal Visualization.
The Temporal Visualization tab will remain visible, showing the attributes you have selected, even if you restart the debugger or Oracle Policy Modeling. It will be hidden again once you remove any attributes you have been viewing and restart the debugger.
Understand temporal outcomes
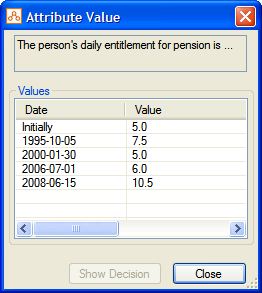
When an attribute takes multiple values over time it can be useful to view a list of the attribute's values and the dates that each of the values apply from.
To view the values for an attribute in the debugger:
Select the attribute in the Data view or Decision view, right-click and select View Value... (Alternatively, if the attribute is an intermediate level attribute, you can just double-click the attribute.)
In the Attribute Value dialog box you can see all the values (change points) for the attribute.
Understand why an inferred attribute has a particular value on a particular date
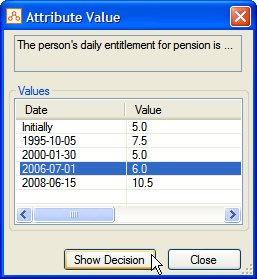
You may want to understand why an inferred attribute has a particular value on a particular date. To investigate this:
Select the date/value in the Attribute Value dialog box and then click the Show Decision button.
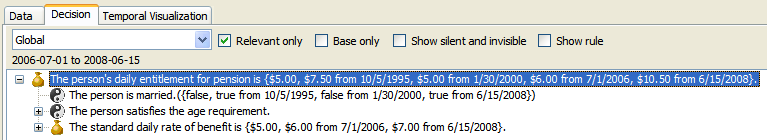
The Decision view opens to show everything relevant to that particular value. You can then review the reason why the attribute has that value from that date.
NOTE: The Decision view will limit the relevance period for the decision tree to the period from the current change point to the next change point for the attribute. In other words, only attributes relevant to proving the value of your chosen goal within the relevance period, will be displayed in the Decision Report. Note, however, that any attribute which is displayed in the Decision Report, will display its whole timeline in {curly brackets} after the attribute text, and not just the portion of the timeline which is relevant to proving the value of your chosen goal within the relevance period.
Limit the display range of attribute value
You may want to limit the display range of attribute values so that you can focus on a particular date range that interests you. To do this:
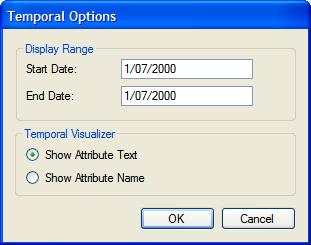
Click on the Temporal Options button in the debugger.
In the Temporal Options dialog box, specify a Start Date and an End Date. Note that the Start Date is inclusive and the End Date is exclusive.
Click OK. In the Data view, the values in the Value column will be limited to the dates specified in the Display Range.