Map Visualization
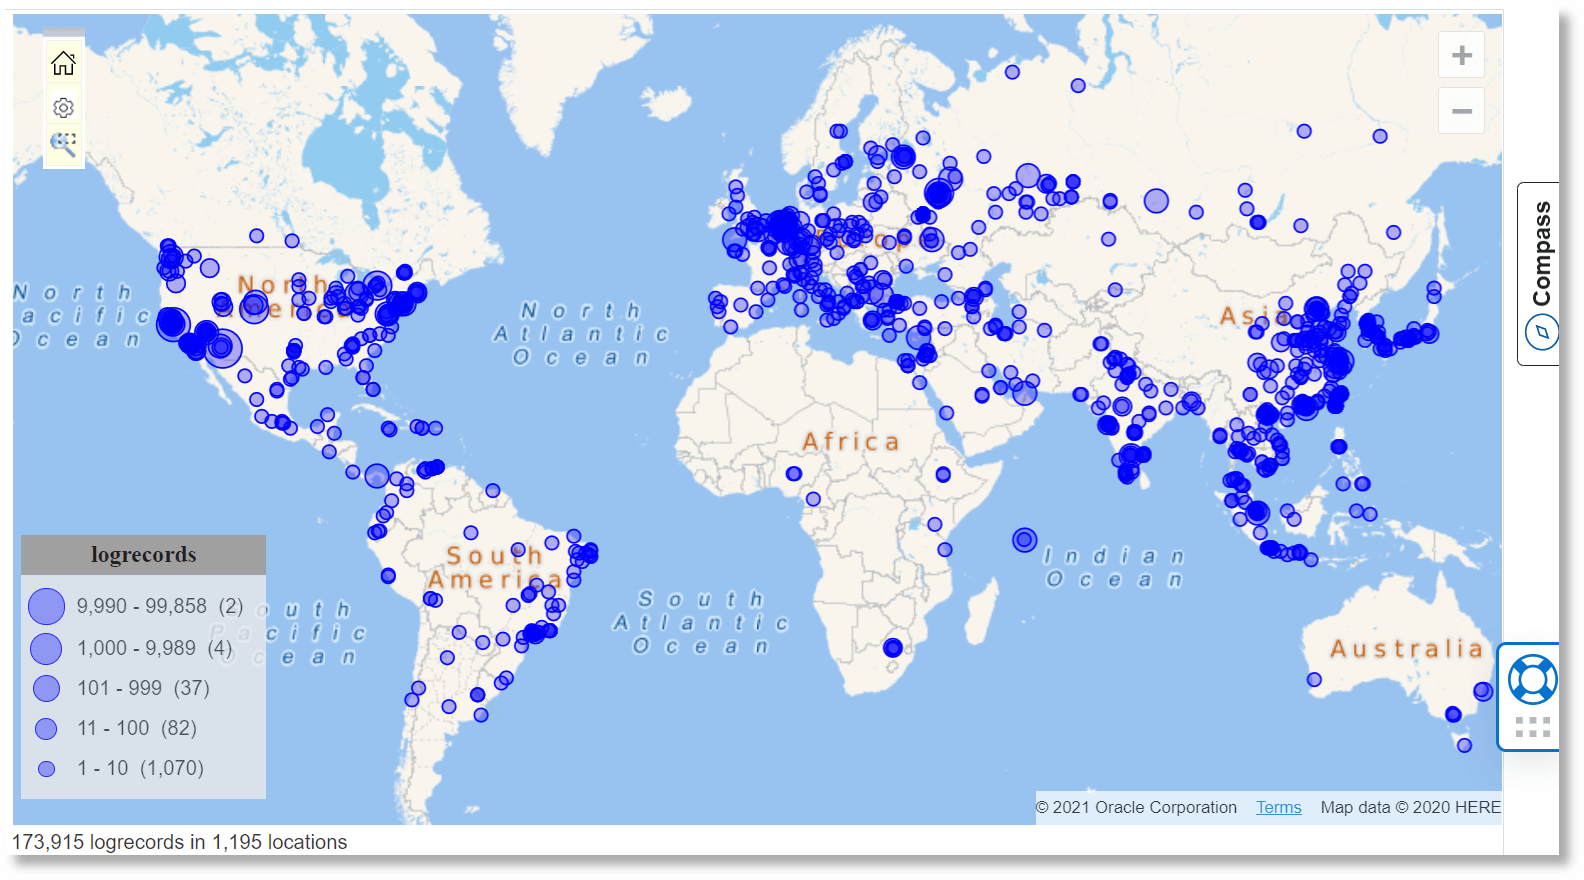
You can use the Map visualization in Oracle Log Analytics to view log records grouped by the location from where the logs are collected.
Additional Topics:
Specify Geo-location Using
geostats Command
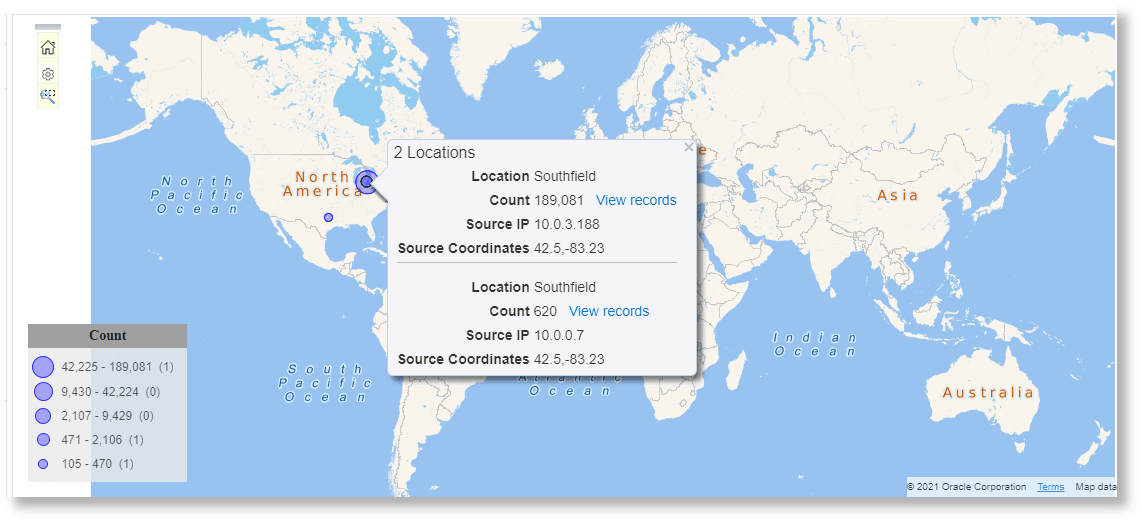
The Map visualization uses the geo-location coordinates to display aggregate results on a map. These coordinates are enriched during the log ingestion, based on an IP address field. However, not all the IP addresses may have valid coordinate field. You can now supply your own coordinates when the default enrichment is incorrect or is missing the information.
Use the include=custom option to the geostats command to specify the fields that contain the geo-location
information. You must supply the Coordinates. You can also optionally specify
the City, Country and Continent. You must then use the
Coordinates field in the by clause.
Following is an example that uses an eval statement to supply these
values:
'Log Source' = 'OCI VCN Flow Unified Schema Logs'
| eval 'Source Coordinates' = if('Source IP' in ('10.0.3.188', '10.0.0.7'), '42.5,-83.23',
                                 'Source IP' = '129.146.13.236', '32.72,-96.68',
                                 null)
| eval 'Source City' = if('Source Coordinates' = '42.5,-83.23',  southfield,
                          'Source Coordinates' = '32.72,-96.68', dallas,
                          null)
| geostats include = custom city = 'Source City' coordinates = 'Source Coordinates'
       count by 'Source IP', 'Source Coordinates'
Specify Geo-location Using a Lookup
Instead of using an eval, you can use a simple or
dictionary lookup to supply the geo-location values. Following is an example
dictionary lookup:
Operator,Condition,Coordinates,City
CIDRMATCH,10.0.3.1/24,"42.5,-83.23",Southfield
CIDRMATCH,129.146.13.1/24,"32.72,-96.68",Dallas
You can then use the lookup in the query:
'Log Source' = 'OCI VCN Flow Unified Schema Logs'
| lookup table = 'Custom Coordinates' select Coordinates as 'Source Coordinates', City as 'Source City' using 'Source IP'
| geostats include = custom city = 'Source City' coordinates = 'Source Coordinates'
count by 'Source IP', 'Source Coordinates'Use Custom Colors in the Map
In the map visualization, you can use custom colors to identify different
values of a field. The field must be included in the Group by section of the
settings. use the highlightgroups command after the
geostats command in the query to specify custom colors.
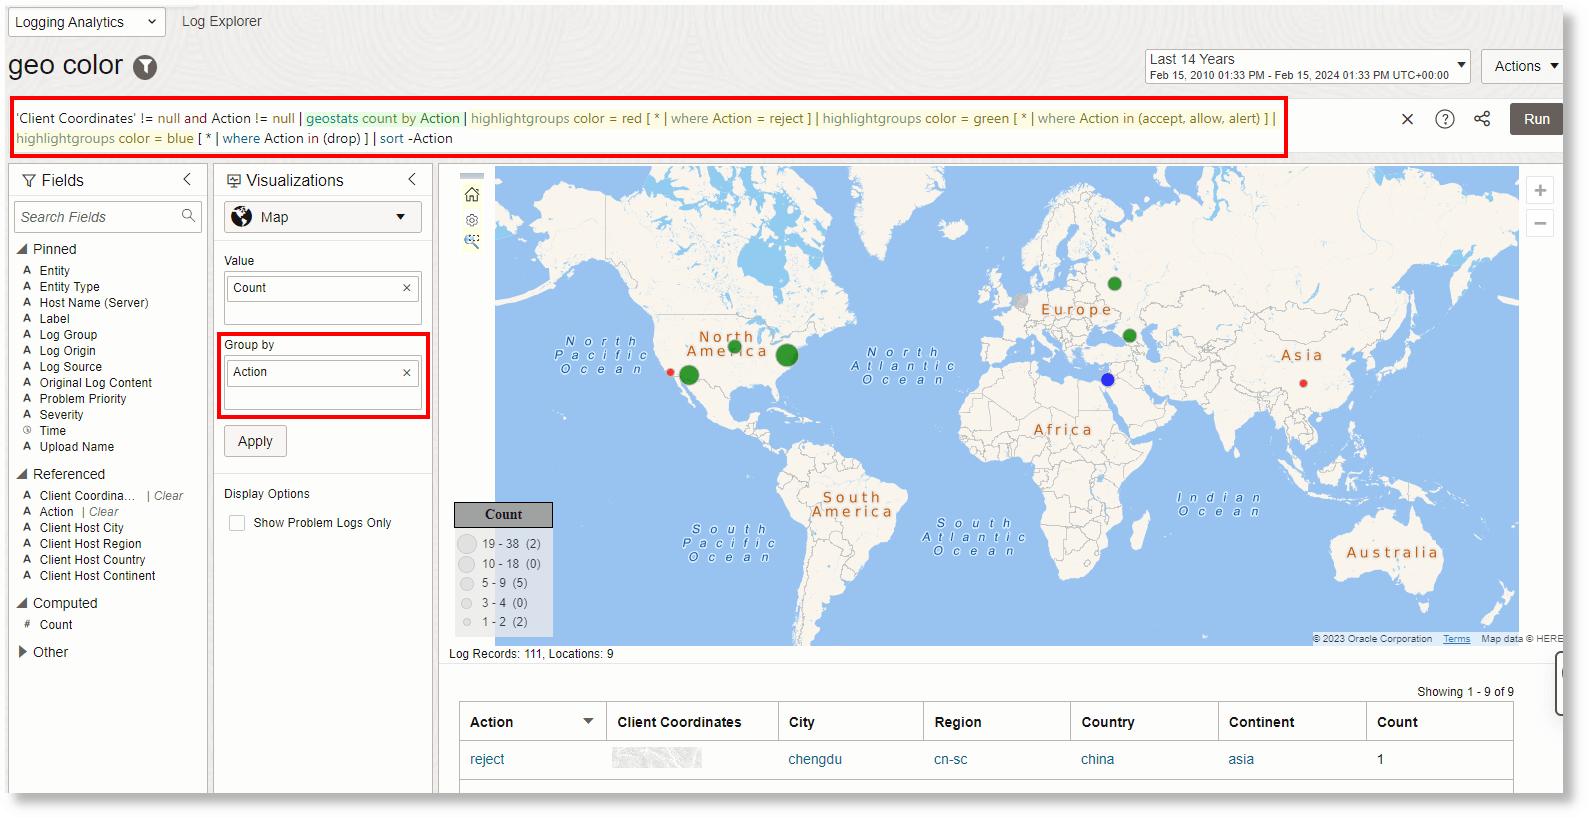
In the following example, the field Action is included in the Group by
section. As a result, the geostats command gets updated with the Action field. Next, the query is
edited to add the highlightgroups command with the color specification such that for specific values of
Action, the corresponding colors are displayed in the map:
| Value of Action field | Color displayed |
|---|---|
reject |
red |
accept, allow,
alert |
green |
drop |
blue |
Example query after the above changes are made:
'Client Coordinates' != null and Action != null | geostats count by Action | highlightgroups color = red [ * | where Action = reject ] | highlightgroups color = green [ * | where Action in (accept, allow, alert) ] | highlightgroups color = blue [ * | where Action in (drop) ] | sort -ActionExample map visualization upon running the above query:

