JavaFX for Swing Developers
3 Enriching Swing Applications with JavaFX Functionality
In this chapter you learn how to intermix a Swing table and JavaFX bar chart in a single application.
This chapter starts with a Swing application and provides an example of how to enrich the Swing application by adding JavaFX functionality.
Sample Swing Application
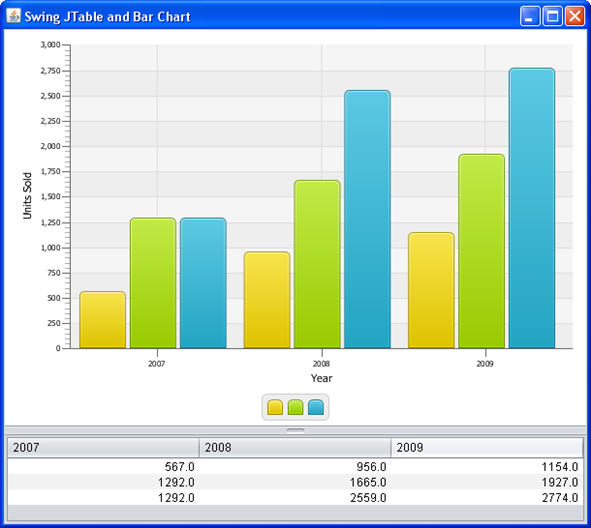
Many real-world projects employ Swing applications that deal with tables. You can continue using the existing code and still take an advantage of JavaFX APIs. For example, you can add a JavaFX bar chart to provide a colorful illustration of the tabular data. This chapter provides the SwingInterop example that handles a Swing table and a JavaFX bar chart. As you change the data in a table cell, the bar chart immediately updates.
Start with the sample application that has only the Swing table shown in Figure 3-1.
Figure 3-1 Swing JTable Application Window

Description of "Figure 3-1 Swing JTable Application Window"
This application consists of two classes:
The SampleTableModel class inherits from the AbstractTableModel class and defines the table.
The SwingInterop class inherits from the JApplet class and is the basic class of the application. Its main method calls the run method on the Event Dispatch Thread (EDT) to create the graphical user interface (GUI). The run method creates a JFrame object and a JApplet object, and initializes the JApplet object with an instance of the SwingInterop class. Then it calls the init method, which creates the table and adds the table to the content pane of the applet.
You can see the implementation of both classes by using the links in the sidebar.
Integrating JavaFX Bar Chart
To provide data for a bar chart, modify the SampleTableModel class by adding a new class variable (bcData) and a method that retrieves data from the table and returns the data in the format appropriate for the bar chart. The implementation of the getBarChartData method is shown in Example 3-1.
Example 3-1
import javafx.collections.FXCollections;
import javafx.collections.ObservableList;
import javafx.scene.chart.BarChart;

public class SampleTableModel extends AbstractTableModel {
    private static ObservableList<BarChart.Series> bcData;

    public ObservableList<BarChart.Series> getBarChartData() {
        if (bcData == null) {
            bcData = FXCollections.<BarChart.Series>observableArrayList();
            for (int row = 0; row < getRowCount(); row++) {
                ObservableList<BarChart.Data> series =
FXCollections.<BarChart.Data>observableArrayList();
                for (int column = 0; column < getColumnCount(); column++) {
                    series.add(new BarChart.Data(getColumnName(column),
getValueAt(row, column)));
                }
                bcData.add(new BarChart.Series(series));
            }
        }
        return bcData;
    }
//rest of the SampleTableModel class code
}
The SwingInterop class overrides the JApplet.init method to create the content pane of the application. Modify the init method to create a JFXPanel object to hold the JavaFX bar chart and a JSplitPane object to hold both the JavaFX chart and the table. The required changes to the init method are shown in bold in Example 3-2.
Example 3-2
@Override
public void init() {
    tableModel = new SampleTableModel();
    // create javafx panel for charts
    chartFxPanel = new JFXPanel();
    chartFxPanel.setPreferredSize(new Dimension(PANEL_WIDTH_INT, PANEL_HEIGHT_INT));

    //create JTable
    JTable table = new JTable(tableModel);
    table.setAutoCreateRowSorter(true);
    table.setGridColor(Color.DARK_GRAY);
    SwingInterop.DecimalFormatRenderer renderer =
new SwingInterop.DecimalFormatRenderer();
    renderer.setHorizontalAlignment(JLabel.RIGHT);
    for (int i = 0; i < table.getColumnCount(); i++) {
        table.getColumnModel().getColumn(i).setCellRenderer(renderer);
    }
    JScrollPane tablePanel = new JScrollPane(table);
    tablePanel.setPreferredSize(new Dimension(PANEL_WIDTH_INT,
TABLE_PANEL_HEIGHT_INT));
    JPanel chartTablePanel = new JPanel();
    chartTablePanel.setLayout(new BorderLayout());

    //Create split pane that holds both the bar chart and table
    JSplitPane jsplitPane = new JSplitPane(JSplitPane.VERTICAL_SPLIT);
    jsplitPane.setTopComponent(chartTablePanel);
    jsplitPane.setBottomComponent(tablePanel);
    jsplitPane.setDividerLocation(410);
    chartTablePanel.add(chartFxPanel, BorderLayout.CENTER);

    //Add the split pane to the content pane of the application
    add(jsplitPane, BorderLayout.CENTER);
}
To get rid of a syntax error, add import statements and the definition of the chartFxPanel class variable to the SwingInterop class as shown in Example 3-3.
Example 3-3
import javafx.embed.swing.JFXPanel;
import javax.swing.*;

public class SwingInterop extends JApplet {
    private static JFXPanel chartFxPanel;
// rest of the SwingInterop class code here
}
You prepared the UI of your Swing application to render JavaFX data. The next step is creating the JavaFX scene. Because the JavaFX scene must be created on the JavaFX Application thread, wrap your code into a Runnable object as shown in Example 3-4. Add this code at the end of the init method.
Add the import statement shown in Example 3-5 to the SwingInterop class.
Implement the createScene method of the SwingInterop class as shown in Example 3-6. Add the import statements and define the instance variable chart.
Example 3-6
import javafx.scene.Scene;
import javafx.scene.chart.Chart;

private void createScene() {
    chart = createBarChart();
    chartFxPanel.setScene(new Scene(chart));
}
The createBarChart method creates the chart diagram and adds a change listener to the table. Note that any change of JavaFX data must happen on the JavaFX thread. For this reason, wrap the code in the event handler, which updates the JavaFX chart, into a Runnable object and pass it to the Platform.runLater method. The implementation of the createBarChart method is shown in Example 3-7.
Example 3-7
private BarChart createBarChart() {
    CategoryAxis xAxis = new CategoryAxis();
xAxis.setCategories(FXCollections.<String>observableArrayList(tableModel.
getColumnNames()));
    xAxis.setLabel("Year");
    double tickUnit = tableModel.getTickUnit();

    NumberAxis yAxis = new NumberAxis();
    yAxis.setTickUnit(tickUnit);
    yAxis.setLabel("Units Sold");

    final BarChart chart = new BarChart(xAxis, yAxis, tableModel.getBarChartData());
    tableModel.addTableModelListener(new TableModelListener() {

        public void tableChanged(TableModelEvent e) {
            if (e.getType() == TableModelEvent.UPDATE) {
                final int row = e.getFirstRow();
                final int column = e.getColumn();
                final Object value =
((SampleTableModel) e.getSource()).getValueAt(row, column);

                Platform.runLater(new Runnable() {
                    public void run() {
                        XYChart.Series<String, Number> s =
(XYChart.Series<String, Number>) chart.getData().get(row);
                        BarChart.Data data = s.getData().get(column);
                        data.setYValue(value);
                    }
                });
             }
         }
    });
    return chart;
}
Add the import statements shown in Example 3-8.
Example 3-8
import javafx.collections.FXCollections;
import javafx.scene.chart.BarChart;
import javafx.scene.chart.CategoryAxis;
import javafx.scene.chart.NumberAxis;
import javafx.scene.chart.XYChart;
import javax.swing.event.TableModelEvent;
import javax.swing.event.TableModelListener;
Rename the title of the frame to "Swing JTable and Bar Chart" and run the SwingInterop application.
The application window is shown in Figure 3-2.
Figure 3-2 SwingInterop Application Window

Description of "Figure 3-2 SwingInterop Application Window"
 Irina has written tutorials and technical articles on Java and JavaFX technologies. She lives in St. Petersburg, Russia. In her spare time, she enjoys swing dancing, playing piano, and reading.
