| Oracle® Java Micro Edition Embedded Client Developer's Guide Release 1.1 E20632-02 |
|
 Previous |
 Next |
| Oracle® Java Micro Edition Embedded Client Developer's Guide Release 1.1 E20632-02 |
|
 Previous |
 Next |
This chapter describes how to debug an application with the NetBeans integrated development environment (IDE).
This chapter includes these topics:
You can remotely debug a CDC application with most debuggers that support the Java Virtual Machine Tool Interface (JVMTI) described in http://download.oracle.com/javase/6/docs/platform/jvmti/jvmti.html. The most likely choices are the NetBeans, Oracle JDeveloper, and Eclipse integrated development environments, but you can also use the Java SE jdb command line debugger or another compatible debugger. You run the debugger on a development host, and the application plus CDC on the target device. CDC and the debugger communicate over a network.
CDC debugging has the following limitations:
Only interpreted code can be debugged.
CDC-debugger connections must use sockets. Shared memory connections are not supported.
cvm in Debug ModeRegardless of the debugger you choose, you launch cvm running the application in the same way.
|
Note: With the Oracle Java ME Embedded Client, cvm is installed on your system in the following location: InstallDir/Oracle_JavaME_Embedded_Client |
cvm Debug Mode SyntaxExample 3-1 and Example 3-2 show how to launch cvm in debug mode on a target device. These examples assume that the target device runs a Unix-style operating system and that socket networking is operational. Make adjustments as necessary for your target device. Use nfs networking if available to mount the workstation directory containing the compiled classfiles on the target device. Or, copy the classfiles from the workstation to the device using ftp or scp.
Be sure to set up the environment variables correctly before running cvm. For example,
CVM_HOME=/mnt/sda1/work/cvmCLASSPATH=/mnt/sda1/workCLASSNAME=helloworld.Helloworld
Chose the appropriate command syntax and sub-options to launch cvm in debug mode.
For the appropriate command syntax and a list of debug sub-options, run
cvm -agentlib:jdwp=help
or refer to http://download.oracle.com/javase/1.5.0/docs/guide/jpda/conninv.html.
Example 3-1 cvm Listens for Connection from Debugger
% cvm -agentlib:jdwp=transport=dt_socket,server=y,address=port -Xdebug \
-classpath $CLASSPATH $CLASSNAME
Example 3-2 cvm Connects to Debugger
% cvm -agentlib:jdwp=transport=dt_socket,server=n,address=host:port -Xdebug \ -classpath $CLASSPATH $CLASSNAME
When launching cvm in debug mode, observe the following requirements:
-agentlib:jdwp and the transport and address sub-options must be specified.
The transport value must be dt_socket.
Set server to y to direct cvm to listen for a connection from the debugger (the most likely case). Set server to n to direct cvm to attach to a listening debugger.
If server=y, set port to the socket port on the target host at which cvm listens for a connection. If server=n, set host:port to the host and socket port at which the debugger waits for a connection from cvm.
-Xdebug disables the compiler so the virtual machine interprets the application's bytecodes.
cvm Debug Mode ExampleExample 3-3 shows a simple example of launching cvm as a server to debug a HelloWorld application.
cvmAlthough this section describes the NetBeans debugger, other IDE debuggers that are compatible with the Java Virtual Machine Tool Interface (JVMTI) can be used similarly. This section first describes the most common arrangement in which cvm acts as a server for the debugger, then the converse case.
Load the NetBeans project you want to debug and create a debugger operation, such as a breakpoint. Figure 3-1 shows an example.
Ensure that the project's compiled class files are accessible to the target host and that the class files correspond to the source files loaded in the IDE.
On the target host, launch cvm with server=y and, for this example, address=8000, similar to the example in Section 3.2.2, "cvm Debug Mode Example".
In NetBeans, choose Debug > Attach Debugger.
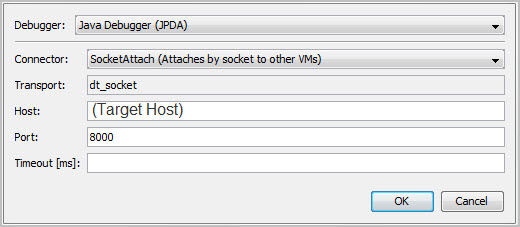
Set up the Attach Debugger dialog as shown in Figure 3-2.
Substitute the target host name for (Target Host).
Figure 3-2 Attach Debugger Dialog (Debugger as Client)

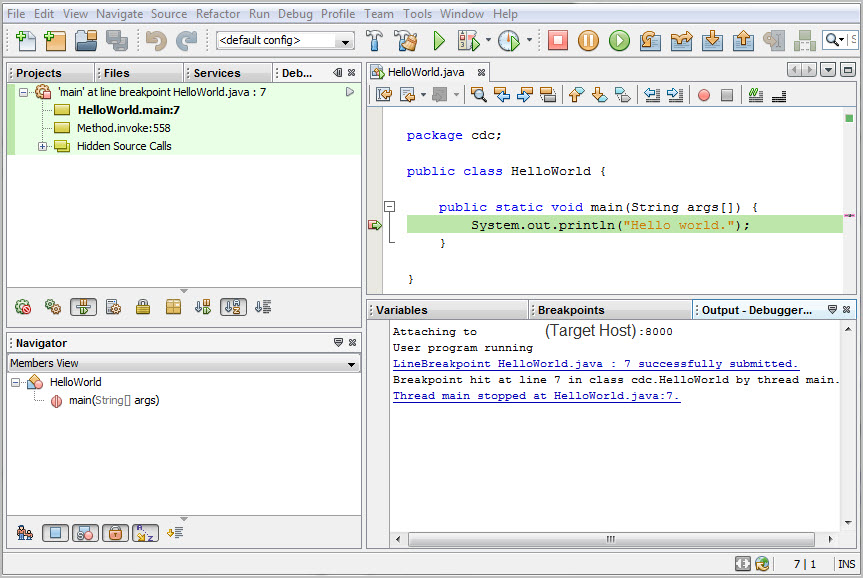
The debugger connects and indicates that execution has stopped at the breakpoint as similar to Figure 3-3.
Figure 3-3 Debugger Connected and Stopped at Breakpoint

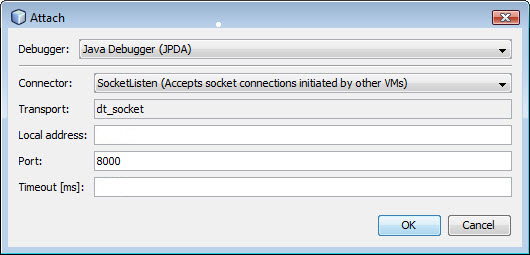
If you want the debugger to be the server, complete the Attach Debugger dialog similar to Figure 3-4. After clicking OK, launch cvm on the target host with server=n and address= the debuggers' host and port.
Figure 3-4 Debugger as Server Attach Debugger Setup

cvm with jdbAfter launching cvm as a debug server (see Section 3.2.2, "cvm Debug Mode Example") on the target host, you can connect to it with the jdb command line debugger using syntax similar to Example 3-4. The jdb command is in JavaSEinstall/bin/.