| Exit Print View | |
Java Platform Micro Edition Software Development Kit Version 3.0 |

|
Viewing and Editing Project Properties
Running Projects in the Emulator
Searching the WURFL Device Database
Finding Files in the Multiple User Environment
CLDC Emulation on a Windows Mobile Device
Installing CLDC Emulation on a Windows Mobile Emulator
Attach a Command Line Debugger
JSR 82: Bluetooth and OBEX Support
JSR 135: Mobile Media API Support
JSR 177: Smart Card Security (SATSA)
JSRs 184, 226, and 239: Graphics Capabilities
JSR 205: Wireless Messaging API (WMA) Support
JSR 211: Content Handler API (CHAPI)
JSR 238: Mobile Internationalization API (MIA)
Before starting this procedure ensure your environment is properly configured:
Integrate the device as described in CLDC Emulator Installation for a Device Running Windows Mobile.
Confirm the device is connected and that it appears in the Device Selector window.
If the output console is not visible, select Window > Output > Output to open it.
If the project you want to debug is not main, right-click and select Set as Main Project.
Only one debug process can run on a port. In the device selector, right-click on a device and look for the Debug Port property. By default the port number is 51307. If you are debugging on 51307 and you wish to debug an additional project, you must run on a different device and change its port number property.
This procedure features command line debugging, but you can use a graphical debugger in a similar fashion.
Select the project you want to debug and select Run > Run Project in Debug Mode or click the Run Main Project in Debug mode icon on the toolbar.
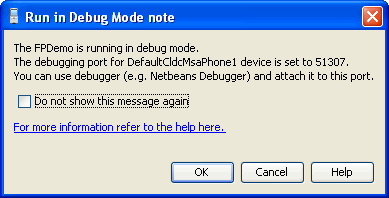
The first time you debug you see this dialog.

Make note of the debugging port for the device, and click OK. If you suppress this dialog you can still get the port number from the Output window. Look for the message “Starting emulator with port number port-number”.
The application is now deployed and started on the connected device. You are ready to attach a debugger.
See Attach a Command Line Debugger, Attach a Graphical Debugger and Sample CLDC Debugging Session