| Oracle® Java Micro Edition Software Development Kit Developer's Guide Release 3.2 for Windows E24265-04 |
|
 Previous |
 Next |
| Oracle® Java Micro Edition Software Development Kit Developer's Guide Release 3.2 for Windows E24265-04 |
|
 Previous |
 Next |
This chapter describes how to use tracing and the memory monitor to examine an application's memory use on a particular device.
Activating tracing for a particular device enables you to see low-level information as an application runs.
The Memory Monitor shows memory use as an application runs. It displays a dynamic detailed listing of the memory usage per object in table form, and a graphical representation of the memory use over time. You can take a snapshot of the memory monitor data. Snapshots can be loaded and examined later.
|
Note: The memory use you observe with the emulator is not exactly the same as the memory use on a real device. Remember, the emulator does not represent a real device. It is one possible implementation of its supported APIs. |
Follow these steps to enable tracing.
In the Device Selector window, right-click on a device and choose Properties.
In the Properties window, go to the Monitor node and check the desired trace options.
Trace GC (garbage collection). Monitoring GC can help you determine object health. The garbage collector can't delete objects that don't have a null reference. Dead objects will be garbage collected and not reported as live.
Trace Class Loading. Observing class initialization and loading is useful for determining dependencies among classes.
Trace Exceptions. Display exceptions caught.
Trace Method Calls. Reports methods called and returned. The output for this option is very verbose and it can affect performance.
(Optional) Verbose tracing output might cause you to run out of memory on the device before the application is fully tested. You can increase the device memory as follows:
Right-click on a device and choose Properties. From the General node, choose Heapsize, and choose a size.
Tracing data is displayed in the output window (Window > Output > Output) when an application is run on this device. It is also written to the device log, which is stored in the working directory for the device. For example:
userhome\javame-sdk\3.2\work\JavaMEPhone1\device.log
Follow these steps to examine an application's memory use.
|
WARNING: Do not suspend the emulator while using the memory monitor. |
In the Projects view, right-click on the project and select Profile.
If the profiler is not yet integrated you are prompted to enable profiling for the project. Click Yes to continue.
The Profile window opens.
The output window tab is labeled "memory-monitor" indicating that the memory monitor is active for this session. The output window displays both application status and tracing outputs for this device.
The memory monitor opens.
Interact with the application as usual.
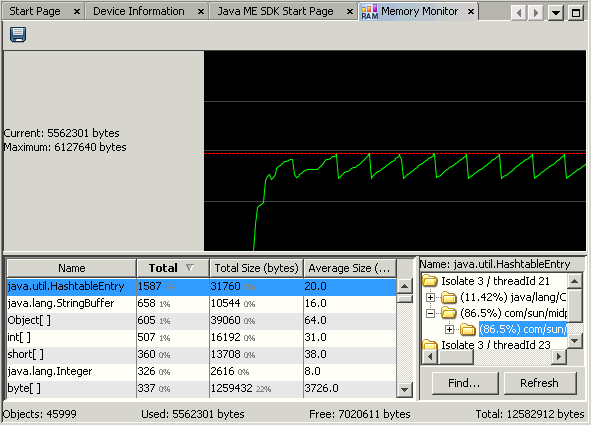
In the Memory Monitor tab you see data displayed on the graph above and in the object table below.
To the left of the graph you see the Current memory use in bytes. The green line plots these values. The red line is the maximum amount of memory used since program execution, corresponding to the Maximum size in bytes on the left.
The object table columns are as follows:
Name. Object class name.
Total. Total number of objects allocated since the application began.
Total Size. Total amount of memory the object uses in bytes.
Average Size. Average object size in bytes, calculated by dividing the number of live instances by the total size.
Beneath the table you see counters displaying the total number of objects, the amount of memory used, the amount of free memory, and the total amount of memory on the device.

Interact with the object table while the memory monitor is running.
Click a column header to sort the data. The sorting is case sensitive.
Click a row and the call stack tree is displayed in the window to the right of the table.
Double-click a folder to browse the call stacks tree to see the methods that create the object.
To find a particular method in the call stacks tree, click the Find button and enter a search string.
Click Refresh to update the call stacks tree as data is gathered. It is not refreshed automatically.
Take a snapshot of the memory monitor. Because the data changes rapidly it is convenient to take several snapshots and review them later.
Click the "Save session to file" icon above the graph and specify a file name and location for the monitor data. The automatically supplied extension is .mms.
Exit the application.
Some applications contain multiple MIDlets.
When you exit a MIDlet the table data is cleared.
The graph data is not cleared when you exit a MIDlet. The graph data you see is cumulative for this emulator session. The memory monitor plots session data for any MIDlet run on the current emulator until you exit the application and close the emulator.