| Oracle® Java Micro Edition Software Development Kit Developer's Guide Release 3.2 for Windows E24265-04 |
|
 Previous |
 Next |
| Oracle® Java Micro Edition Software Development Kit Developer's Guide Release 3.2 for Windows E24265-04 |
|
 Previous |
 Next |
MIDP applications, at a minimum, are capable of HTTP network connections, but many other types of network connections are also possible. The network monitor provides a convenient way to see the information your application is sending and receiving on the network. This is helpful if you are debugging network interactions or looking for ways to optimize network traffic.
Networking monitoring works for emulators only (it is not supported for real devices).
Follow these steps to activate the network activity for an application.
In the Projects window right-click on a project and select Profile.
If this is the first time profiling this application you are prompted to integrate the profile with the project. Click Yes to perform the integration.
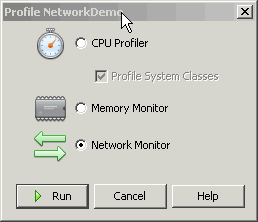
In the Profile window, select Network Monitor, and click Run.

Start your application.
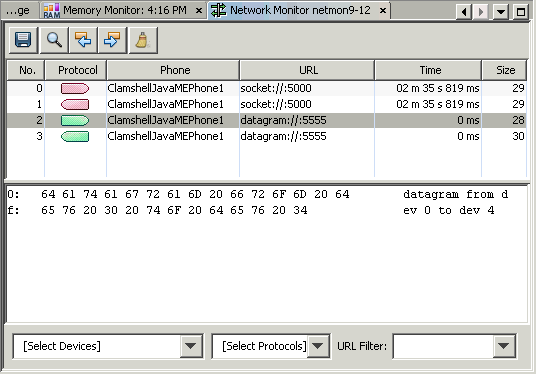
When the application makes any type of network connection, information about the connection is captured and displayed in the Network Monitor tab.

The top frame displays a list of messages. Click a message to display its details in the bottom frame.
In the Hex View, message bodies are shown as raw hexadecimal values with the equivalent text. To avoid memory issues, the Hex view is currently limited to 16kB of data.
|
Note: You can examine messages that are still in the process of being sent. Incomplete messages are indicated by bold highlighting in the message tree. |
Filters are useful for examining some subset of the total network traffic.
In the [Select Devices] list check only the devices you want to view.
In the [Select Protocols] list check only the protocols you want to view. The protocols listed reflect what is currently installed on the device.
Click the magnifying glass in the Network Monitor toolbar to search for a specific string in the data in the Phone or URL columns.
Time. Messages are sorted in chronological order of time sent or received.
URL. Messages are sorted by URL address. Multiple messages with the same address are sorted by time.
To arrange the message tree in a particular order, click on the Sort By combo box and choose a criteria.
|
Note: Sorting parameters are dependent on the message protocol you choose. For example, sorting by time is not relevant for socket messages. |
To save your network monitor session, click the blue disk icon at the left of the Network Monitor toolbar.

Choose a file name. The default file extension is .nmd (network monitor data).
To load a network monitor session, choose Profile > Java ME > Load Network Monitor Snapshot... and browse to the .nmd file you saved.
|
Note: To avoid memory issues, the Hex view display is currently limited to 16kB of data. |
To remove all inactive protocol records from the network monitor choose the clear icon (the broom icon on the right of the Network Monitor tool bar).