| C H A P T E R 5 |
|
Running a Test |
This chapter walks you through an interactive mini-tutorial involving two types of tests, automated and interactive. The purpose of the tutorial is to give you an overview of running tests using the Java Device Test Suite.
Running the tests can take approximately a half-hour. Working through the sample tests, you select, configure, and run tests. Later, you view the test results and reports that you generate.
This chapter has the following sections:
If are you are running the Solaris operating system, choose a test device that supports the HTTP protocol.
If you are running Windows, use the Wireless Toolkit emulator (if you choose to use a test device, be sure it supports the HTTP protocol). Use Wireless Toolkit version 2.5 to run these test sets. You can obtain the Wireless Toolkit emulators from http://java.sun.com/products/j2mewtoolkit/index.html.
|
To be sure that your experience of the sample test runs matches the steps given in the following sections, follow these preliminary steps:
1. Launch the harness to open the Test Manager window:
If you have run the harness before, the initial display might look different.
FIGURE 5-1 Test Manager Window
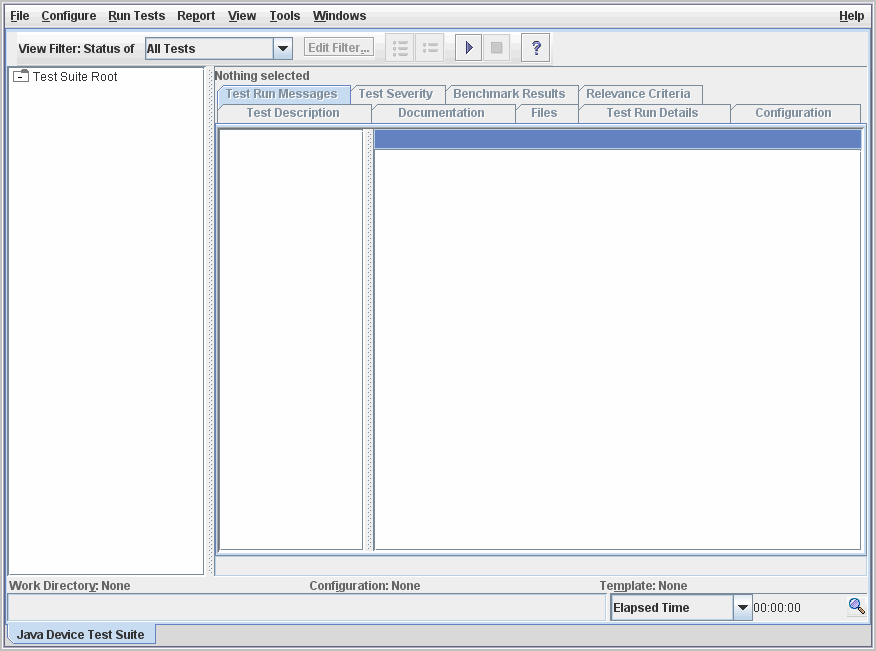
The left pane displays the test tree, which contains the Test Suite Root node and the right pane displays information relevant to the selected item in the test tree. See the online help for a description of the graphical user interface components.
2. Create a directory to contain the work directories and the configuration files that you use for the quick tour.
You can use the default location or you can create a work directory in a location that you prefer. For the purposes of this exercise, use the default location.
a. Choose File > Create Work Directory to create a work directory to use for the first sample test.
The Create Work Directory dialog box opens:
FIGURE 5-2 Create Work Directory Dialog Box
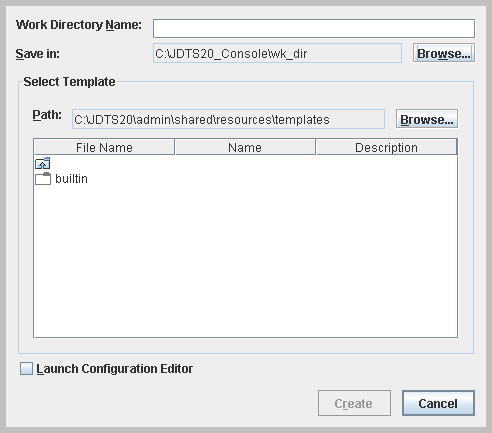
b. Enter a name for this work directory in the text field.
For instance, you can name it Sample_wd for this example.
The default location of the templates directory, jdts_installDir/admin/shared/resources/templates is already provided. If the templates are stored in another location for your situation, click Browse and use the File Chooser to select the templates directory.
For the purposes of this tutorial, double click builtin in the templates directory.
When creating a work directory, you are asked to specify a template. The builtin templates provided with the Java Device Test Suite are not intended for use other than for demonstration tests. Do not use these templates when performing actual work. Updates to builtin templates do not propagate, which means that your configuration is not updated when its template is updated.
Your administrator is responsible for creating the templates you normally use for test runs. Updates to templates created by your administrator are propagated to configurations. For production work, use the templates provided by your administrator.
When you select builtin, the dialog box lists the available templates:
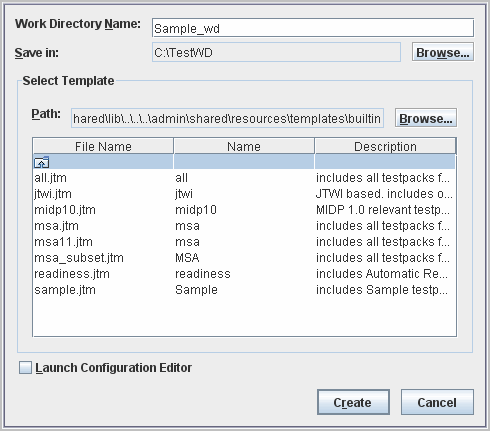
d. Select the sample.jtm template and click Create.
A list of test packs is displayed in the test tree:
FIGURE 5-4 New Instance of Test Manager
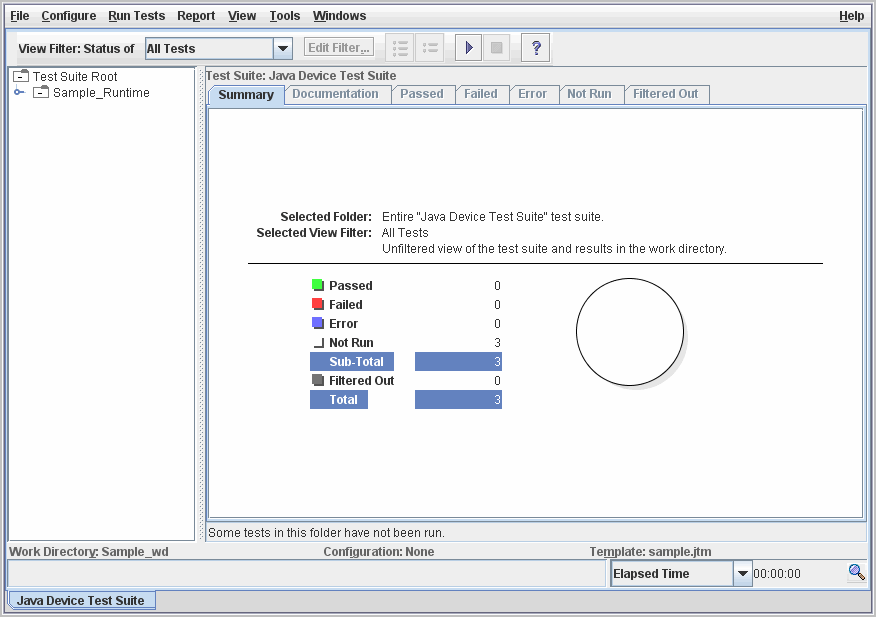
For templates that refer to a large number of test packs, it can take about a minute for the harness to load them.
The work directory is created. At this point you can proceed to the section, Running Automated Tests or to the section, Running an Interactive Test to configure and run the tests.
Automated tests run without your intervention. They determine if the test device passed or failed. The harness captures results returned by the tests, summarizing them automatically.
1. Create a configuration for the sample test run.
a. Choose Configure > New Configuration.
The Configuration Editor opens. The Configuration Editor presents a series of questions in an interview format. You only need to answer those questions that are relevant to your specific test.
b. Click Next and enter a name to identify this configuration.
For example, you could call it sample1.
c. Click Next and enter a brief description of the configuration.
d. Click Next until you get to the Specify Tests to Run question in the interview.
e. Select Yes for Specify Tests to Run and click Next.
f. Select Directly by test or package name and click Next.
The Tests to Run panel of the interview is displayed.
g. Expand the Sample_Runtime node in the Tests to Run panel.
FIGURE 5-5 Tests to Run Panel of the Interview
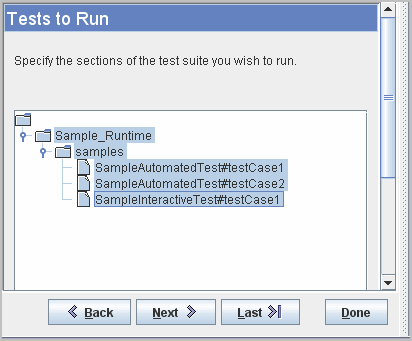
You see the following test cases:
2. Click SampleAutomatedTest#testCase1.
3. Shift + click to extend the selection to SampleAutomatedTest#testCase2 in the Tests to Run panel:
FIGURE 5-6 Sample Automated Tests
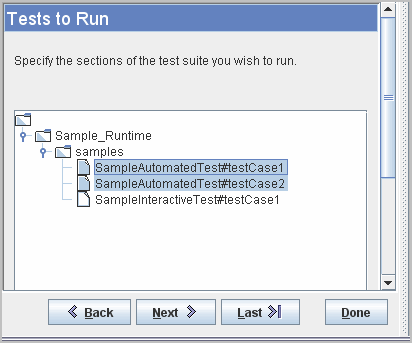
If you select samples, all the test cases in samples are selected. Selecting a high-level node selects all items under that node.
You can use Ctrl + click to make discontiguous selections.
| Note - Clicking a node unselects all previously selected nodes. Inadvertently clicking a node can undo a time-consuming selection task. |
4. Click Next until you get to the Autotest Support question.
5. Select No in the Autotest Support question and click Next.
Not all devices support the autotest protocol. In this example, you specify in the next series of questions how to send the test bundle to the device and how to send results back to the harness from the device.
6. Select By HTTP for the means of transferring the test bundle from the harness to the device, then click Next.
7. For Next Bundle Auto-Request, select Yes if the device supports the MIDP 2.0 specification, then click Next.
This option automatically downloads test bundles.
8. Select Yes to have test results sent by HTTP from the device to the harness.
A Save Configuration File dialog box appears.
10. Enter a name for the configuration file, such as Sample, in the Save dialog box, then click Save File.
Configurations have a .jti extension, which is automatically added to the name you enter.
11. Determine if you want to run tests on your device or on the Wireless Toolkit emulator.
To run tests on the emulator, open the Run Tests menu and make sure Run on Emulator is checked.
If you want to run tests on your own device, uncheck Run on Emulator.
Follow Step 12 through Step 17 if you are running tests on the emulators; otherwise, skip to step Step 18.
12. (Emulator users only) Choose File > Preferences.
The JavaTest Preferences dialog box opens.
If you use the emulator, you must choose an emulator version and set its location.
13. (Emulator users only) Select Java Device Test Suite.
From the drop-down list, choose WTK 2.5 for version 2.5 of the Wireless Toolkit emulator:
FIGURE 5-7 Java Device Test Suite Preferences
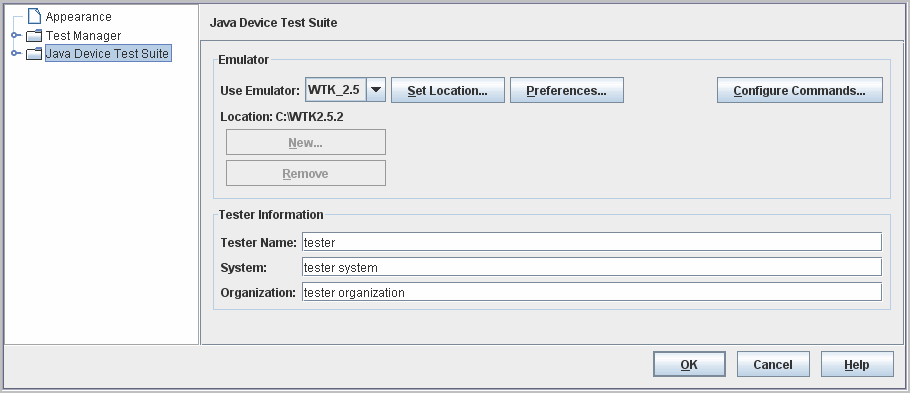
14. (Emulator users only) Click Set Location and select the install directory for the Wireless Toolkit version.
Click Apply after the location is set.
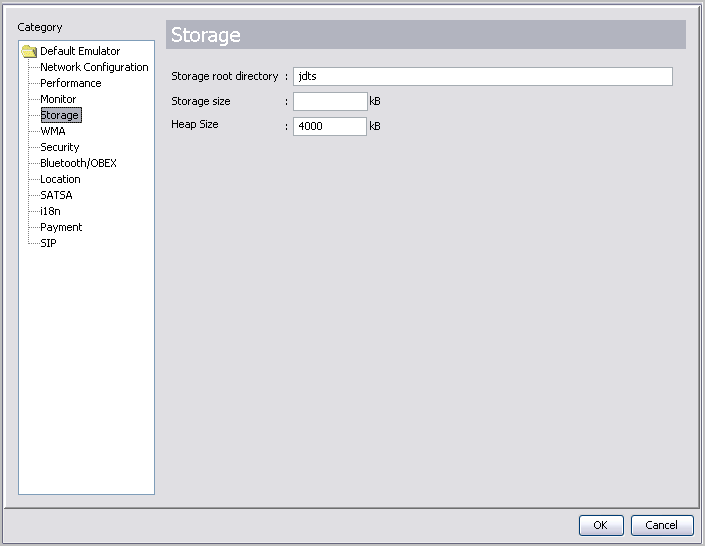
15. (Emulator users only) click Preferences, select Storage, and set the Storage Root Directory to jdts and the Heap Size to 4000:
Leave the Storage size field empty.
FIGURE 5-8 Emulator Preferences
16. Click OK in the dialog box.
17. Click OK in the JavaTest Preferences dialog box to close it.
18. Choose View > Filter > Current Configuration.
Current Configuration enables you to see Summary and status information specifically on the tests selected for the current test run. The All Tests setting shows current totals and status icons for all the tests in the test pack, regardless of the configuration settings.
19. Start the test device if you are not using the emulator.
The Device Status window opens:
FIGURE 5-9 Device Status Window

The Launch Emulator button is disabled if Run on Emulator is not selected in the Run Tests menu.The bundle URL might be different for your installation.
21. Click the Launch Emulator button in the Device Status window.
In a second or two, the display screen on the device (or emulator) shows the application is loaded and ready to be launched:
FIGURE 5-10 Application Transferred to Device
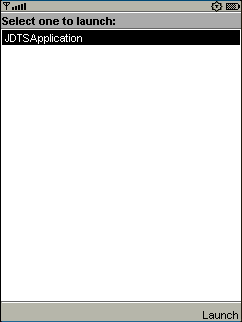
22. Launch the application (this action is device-dependent).
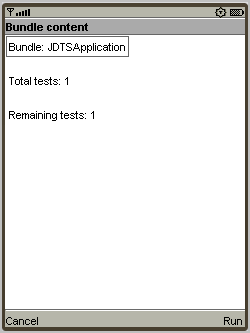
If you are asked for permission to use air time, answer Yes. The device display screen shows that the test bundle contains one test.
FIGURE 5-11 Device Display Screen Showing Number of Tests
23. Run the test (this action is device-dependent).
24. Choose Yes if you are asked if it is okay to use airtime.
For a moment, you can see information in the emulator’s display screen that the test is running.
25. When the test completes, close the emulator window.
26. Click the Launch Emulator button (FIGURE 5-9) again, and run the second test as you did the first.
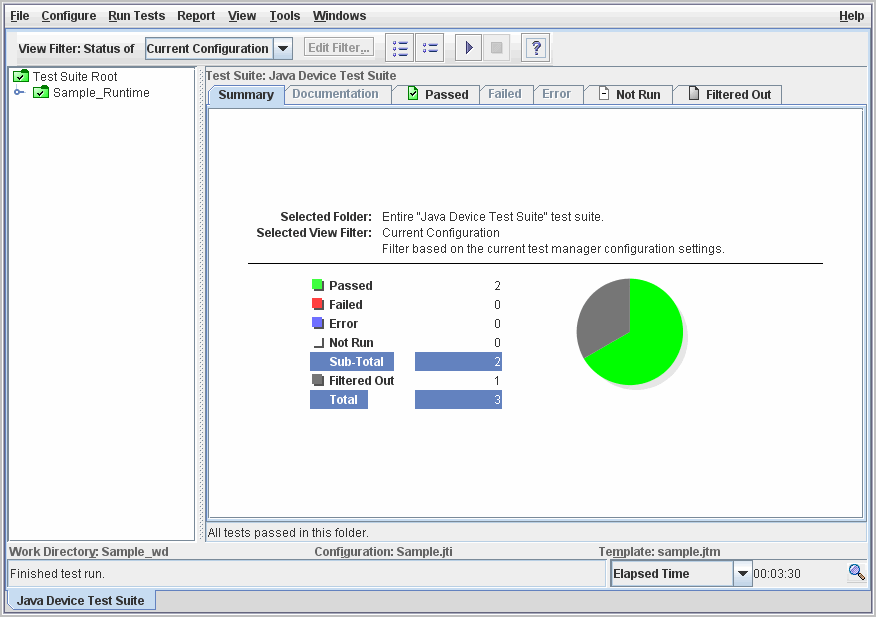
When the second test completes, the emulator exits and the harness Summary tabbed pane shows an overview of the test run:
FIGURE 5-12 Automated Test Results
Expand the Sample_Runtime node in the test tree to see that the two tests are now marked as passed:
FIGURE 5-13 Passed Test Notation in Test Tree
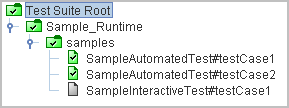
To see information for a specific test, select the test case in the test tree then click a tabbed pane. See the online help for a description of the information shown in the tabbed panes.
Interactive tests involve some action on the tester’s part. A Test Evaluation window appears with instructions for you to perform. For this sample test, you simply decide whether the tests pass or fail. For more information on the Test Evaluation window, see the online help.
| Note - If you have previously run tests using an emulator, clear the generated files in the Wireless Toolkit install_dir/appdb/jdts directory before proceeding with the test. |
To run an interactive test, follow these steps:
1. Create a configuration for the sample test run.
a. Choose Configure > New Configuration.
The Configuration Editor opens. The Configuration Editor presents a series of questions in an interview format. You only need to answer those questions that are relevant to your specific test.
b. Click Next and enter a name to identify this configuration.
For example, you could call it sample1.
c. Click Next and enter a brief description of the configuration.
d. Click Next until you get to the Specify Tests to Run question in the interview.
e. Select Yes for Specify Tests to Run and click Next.
f. Select Directly for How to Specify Tests and click Next.
The Tests to Run panel of the interview is displayed.
g. Expand the Sample_Runtime node in the Test to Run panel.
FIGURE 5-14 Tests to Run Panel of the Interview

2. In the test tree, expand the Sample_Runtime node until you see the following test cases:
3. Click SampleInteractiveTest#testCase1 to select it in the Tests to Run panel:
FIGURE 5-15 Sample Interactive Test
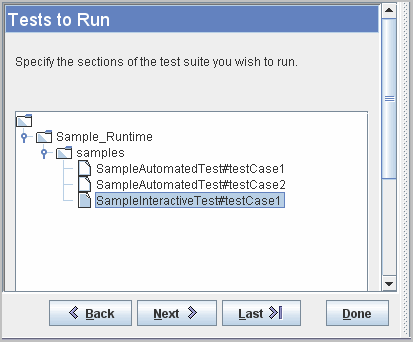
If you select samples, all the test cases in samples are selected. Selecting a high-level node selects all items under that node.
| Note - Clicking a node unselects all non-subordinate nodes. Inadvertently clicking a node can nullify a time-consuming selection. |
4. Click Next until you get to the Autotest Support question.
5. Select No in the Autotest Support question and click Next.
Not all devices support the autotest protocol. In this example, you specify in the next series of questions how to send the test bundle to the device and how to send results back to the harness from the device.
6. Select By HTTP for the means of transferring the test bundle from the harness to the device and click Next.
7. Select Yes for Next Bundle Auto-Request if the device supports the MIDP 2.0 specification, then click Next.
This option automatically downloads test bundles.
8. Select Yes to have test results sent by HTTP from the device to the harness and click Next.
9. Select One test per bundle.
The test is placed in a single test bundle.
A Save Configuration File dialog box appears.
11. Enter a name for the configuration file, such as Sample, in the Save dialog box, then click Save File.
12. Determine if you want to run tests on your device or on the Wireless Toolkit emulator.
To run tests on the emulator, open the Run Tests menu and make sure Run on Emulator is checked.
If you want to run tests on your own device, click Run on Emulator to uncheck it.
Follow Step 12 through Step 18 if you are running tests on the emulators; otherwise, skip to Step 18.
13. (Emulator users only) Choose File > Preferences.
The JavaTest Device Test Suite Preferences dialog box opens.
If you use the emulator, you must choose an emulator version and set its location.
14. (Emulator users only) Select Java Device Test Suite.
From the drop-down list, choose WTK 2.5 for version 2.5 of the Wireless Toolkit emulator.
FIGURE 5-16 Java Device Test Suite Preferences Dialog Box

15. (Emulator users only) Click Set Location and select the install directory for the Wireless Toolkit version.
Click Apply after the location is set.
16. (Emulator users only) click Preferences and set the Storage Root Directory to jdts and the Heap Size to 4000:
Leave the Storage size field empty..
FIGURE 5-17 Emulator Preferences

17. Click OK in the dialog box.
18. Click OK in the JavaTest Preferences dialog box to close it.
19. Choose View > Filter > Current Configuration.
Current Configuration enables you to see Summary and status information specifically on the tests selected for the current test run. The All Tests setting shows current totals and status icons for all the tests in the test pack, regardless of the actual configuration settings.
20. Start the test device if you are not using the emulator.
The Device Status window opens:
FIGURE 5-18 Device Status Window

The Run Emulator button is disabled if Run on Emulator is not selected in the Run Tests menu.The bundle URL might be different for your installation.
22. (Emulator users only) Click Run Emulator in the Device Status window:
In a second or two, the display screen on the device (or emulator) shows the application is loaded and ready to be launched:
FIGURE 5-19 Application Transferred to Device

23. Launch the application (this action is device-dependent).
If you are asked for permission to use air time, grant it. The device display screen shows that one bundle is loaded and a test is ready to run.
FIGURE 5-20 Device Display Screen Showing Number of Tests
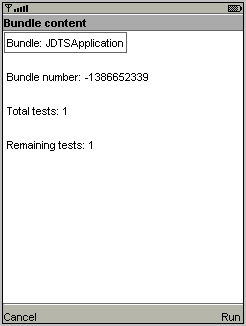
24. Run the tests (this action is device-dependent).
25. Choose Yes if asked if it is okay to use airtime.
The device screen display shows one test has run:
FIGURE 5-21 Device Display Screen Showing One Test Running
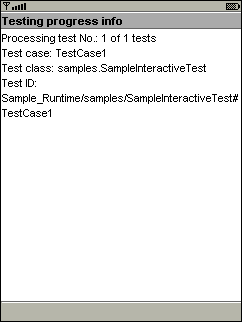
A test evaluation window similar to FIGURE 5-22 soon appears. In a real interactive test, this window instructs you to interact with or inspect the test device for some appearance or behavior, and then click the Passed button if the device behaves correctly or the Failed button if it does not. You can also record a comment typically to note the reason for the failure. testCase1, however, does nothing to the test device, and, therefore, has placeholder instructions.
FIGURE 5-22 Test Evaluation Window
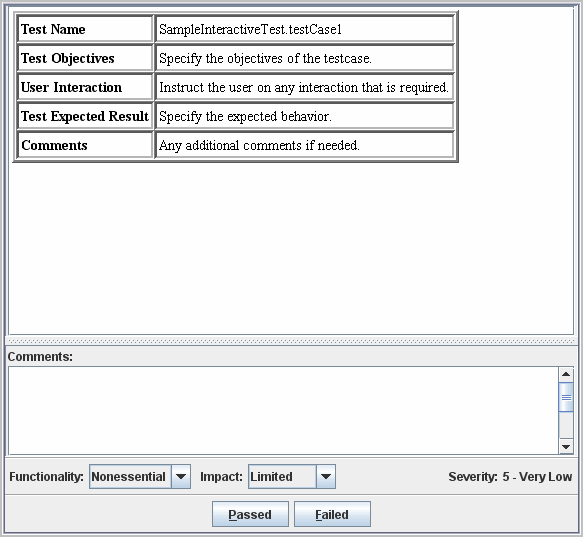
26. In the Comments pane, enter “Failed for demonstration”, then click Failed.
The test run ends and the number of failed tests is shown in the Summary tabbed pane:
FIGURE 5-23 Failed Test Results
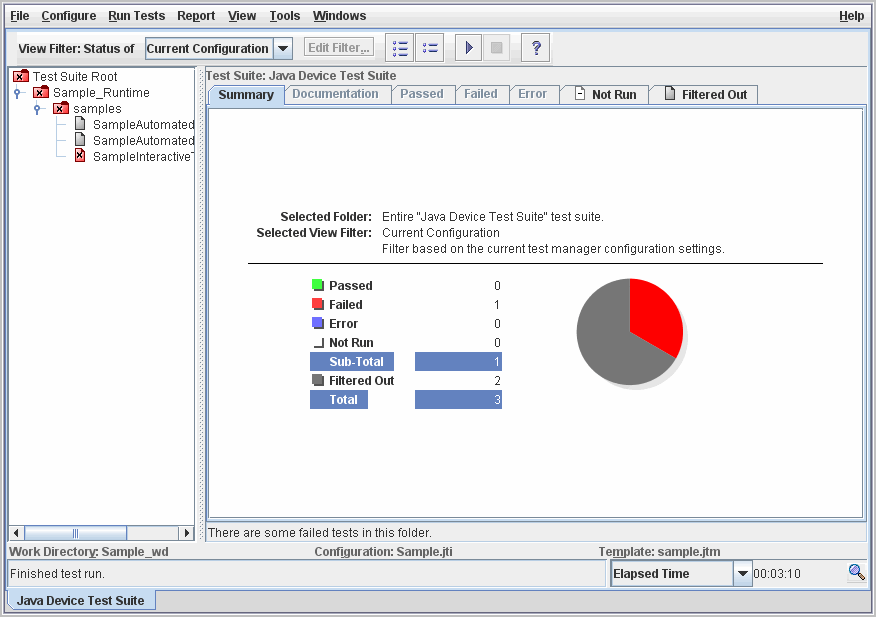
Expand the Sample_Runtime node in the test tree, if necessary, to see that the interactive test is now marked as failed:
FIGURE 5-24 Failed Test Notation in Test Tree
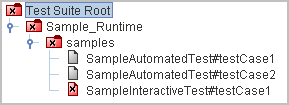
The automated tests are shown as Filtered Out because they are not selected in the configuration’s Tests To Run question.
You have completed the walk through of running basic tests in the Java Device Test Suite. To see information about the test runs, click on the tabs in the test information display pane.
In the Java Device Test Suite, there are several ways to specify the tests that run. You can use them separately or in combination. In the previous exercises, you selected tests directly by name. In this exercise you select them by a combination of device feature and test failure severity. For a description of device features, refer to Device Features. For a description of test failure severity, refer to Test Failure Severity.
1. In the harness test tree, select Test Suite Root, right-click, and choose Clear Results.
This operation sets the status of all tests to Not Run.
2. In the harness, choose Configure > Edit Configuration.
The Configuration Editor appears.
3. Select the Test Selection: How to Specify Tests question.
If you do not see the question, select Test Selection: Specify Tests to Run, and click Yes.
4. Select “Directly by feature name”, then click Next >.
The Features to Run question appears.
The feature tree appears, similar to FIGURE 5-25.
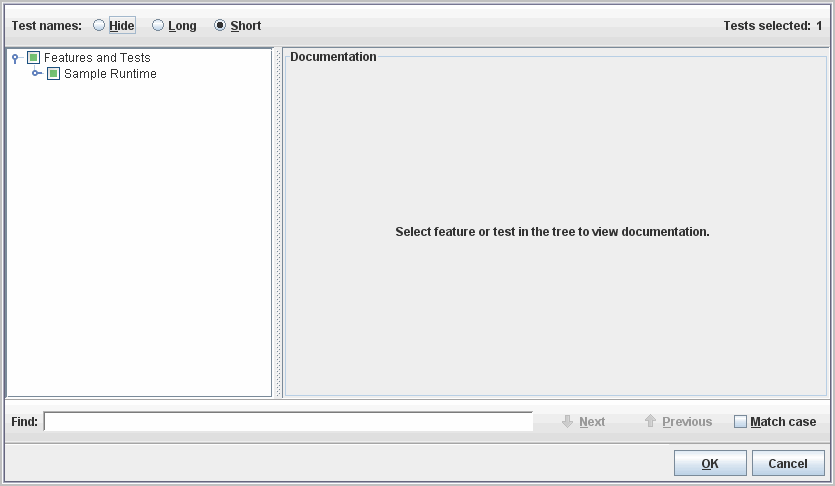
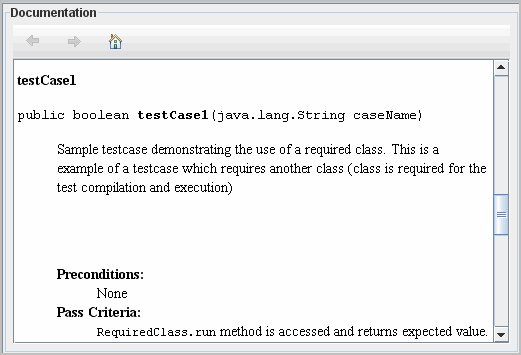
A description of the Sample Runtime feature appears on the right. When you select a test case, its documentation appears on the right. FIGURE 5-26 shows an example.
FIGURE 5-26 Test Case Documentation Example
7. Click the turner next to Sample Runtime to expose its features Automated Tests and Interactive Tests.
Because these are artificial sample tests, the feature names are not representative.
8. Click the turner next to Automated Tests to expose its features or test cases.
FIGURE 5-27 Feature Tree with Tests
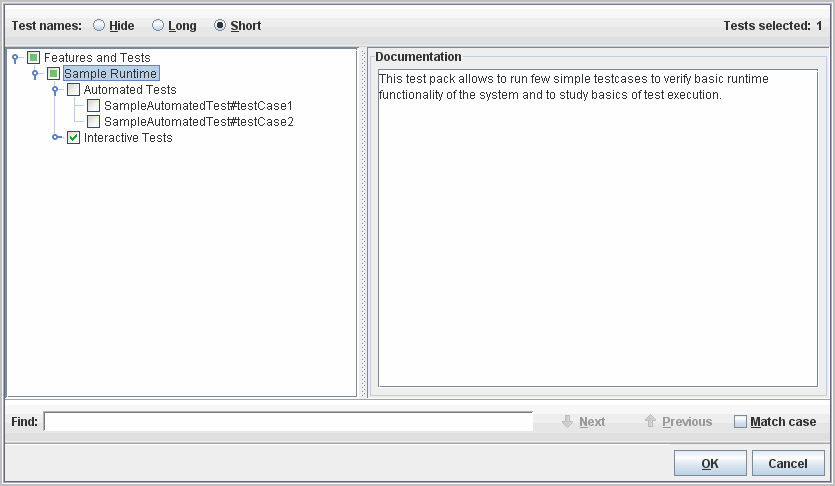
Notice that the test case names (such as SampleAutomatedTest#testCase1) are the same as those in the Tests to Run tree (FIGURE 5-14). You can select tests in either tree or both.
9. Uncheck the box next to Automated Tests, then check the box next to SampleAutomatedTest#testCase2.
Feature selection is “sticky”. There is no need to use the Ctrl or Shift key to select multiple features. Selecting a feature selects its sub-features and tests. The total number of tests you have selected is shown in the upper right.
10. Click OK to close the feature tree.
11. In the configuration editor, select the Specify Test Severity question, select Yes, then click Next >.
The Severity question appears, similar to FIGURE 5-28.
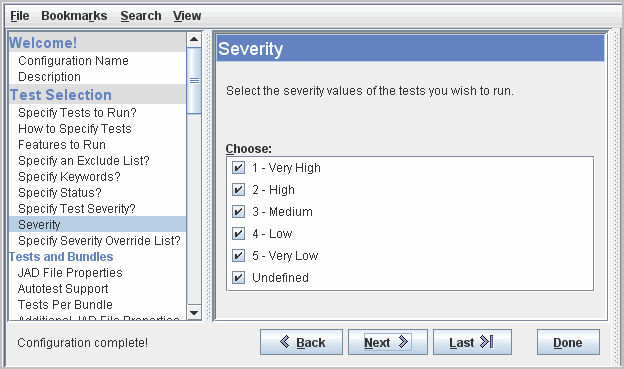
12. Uncheck all boxes except 5 - Very Low.
The sample tests have this severity value. For more information on severities, see Test Failure Severity. You can see a test case’s severity by selecting it in the harness test tree and clicking the Test Severity tab.
| Note - The answers to the questions in the Test Selection section act as a series of filters that are AND-ed together. A test runs only if it passes all filters. For example, suppose a test in the Interactive Tests feature you left selected in Step 9 had a severity of 1 - Very High. This test will not run because it does not pass the Severity filter as it is currently configured (to pass only tests whose severity is 5 - Very Low). Similarly, no test in the Automated Tests feature will run because that feature was unselected in Step 9. |
14. Start the test run as you did in Running Automated Tests or Running an Interactive Test.
When the interactive test begins to run, the evaluation window appears, similar to FIGURE 5-29.
FIGURE 5-29 Test Evaluation Window

15. Choose Secondary in the Functionality drop-down.
Severity changes from 5 - Very Low to 4 - Low. You can change the severity of interactive and tests as they run. The change you have made indicates that you rank this test’s functionality as more important than the test designer did. Accordingly, its failure severity rises.
17. In the harness test tree, select SampleInteractiveTest#testCase1 and click the Test Severity tab.
FIGURE 5-30 shows that your action changed the test severity from 5 to 4.
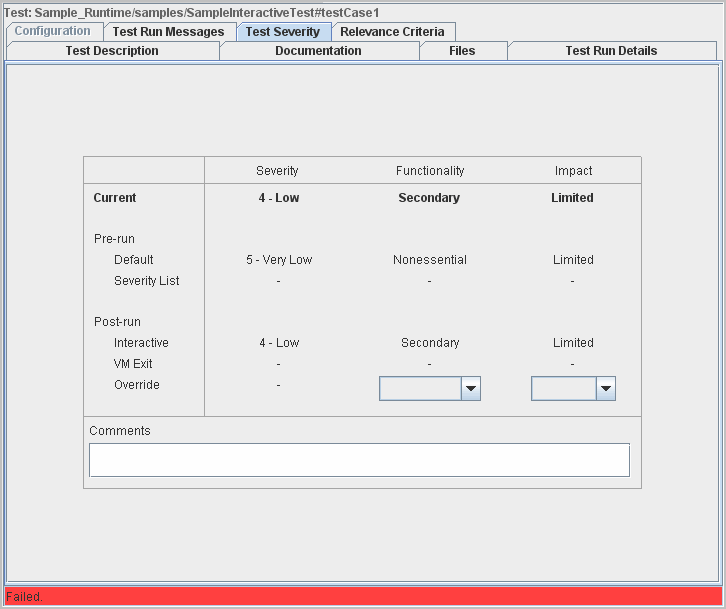
You can change the severity of any test after it has run by selecting new values in the Functionality or Impact drop-downs. Post-run severity changes are erased if the test is run again.
After a test run, the Java Device Test Suite can generate several different kinds of reports. In this section, you create a feature report and a severity report. To create a feature report, follow these steps.
1. In the harness, choose Report > Create Report.
The Create a New Report dialog box appears, similar to FIGURE 5-31.
FIGURE 5-31 Create a New Report Dialog Box
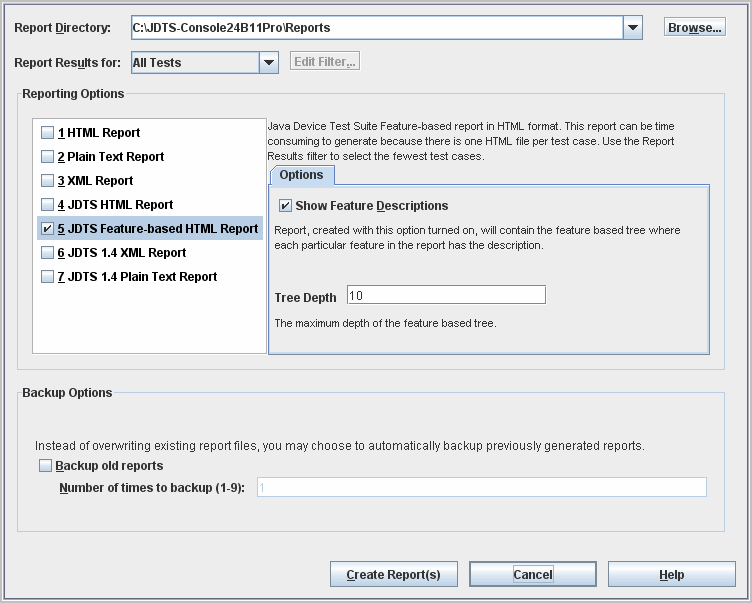
2. In the Report Directory area, browse to or type the name of a directory to contain report files, for example, C:\JDTSSampleReports.
3. In the Report Results for drop-down, select All Tests.
You can use the Report Results filter to specify a subset of features, such as those selected by the current configuration.
4. Click the box next to 5 JDTS Feature-based HTML Report.
6. When the View Report dialog box appears, click Yes.
You can also view reports with a web browser. The report browser appears, similar to FIGURE 5-32.
FIGURE 5-32 Report Browser First Page
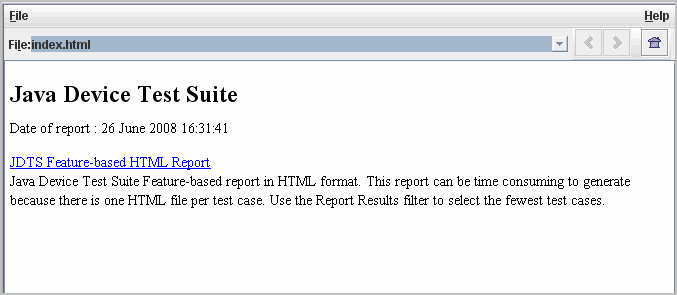
7. Click JDTS Feature-based HTML Report.
The report browser displays the report summary page similar to FIGURE 5-33. The features in the Sample Runtime test pack do not have typical names.
FIGURE 5-33 Sample Feature Report
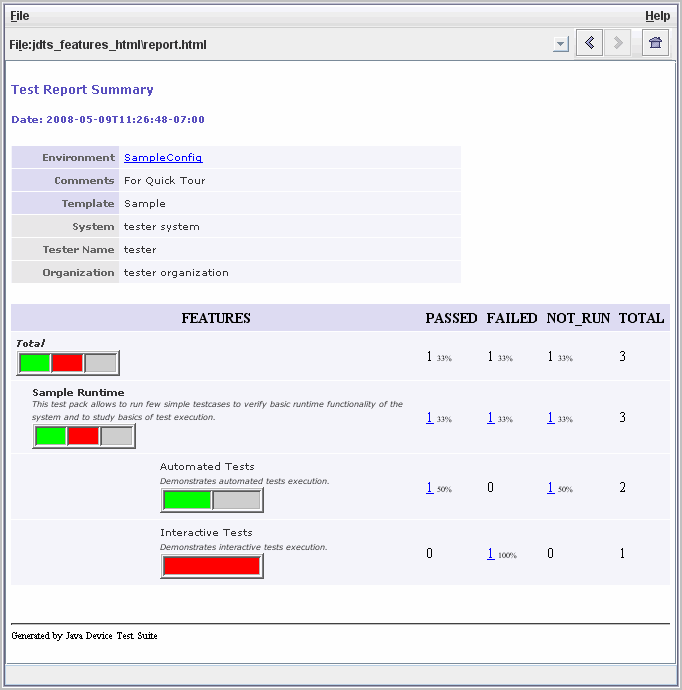
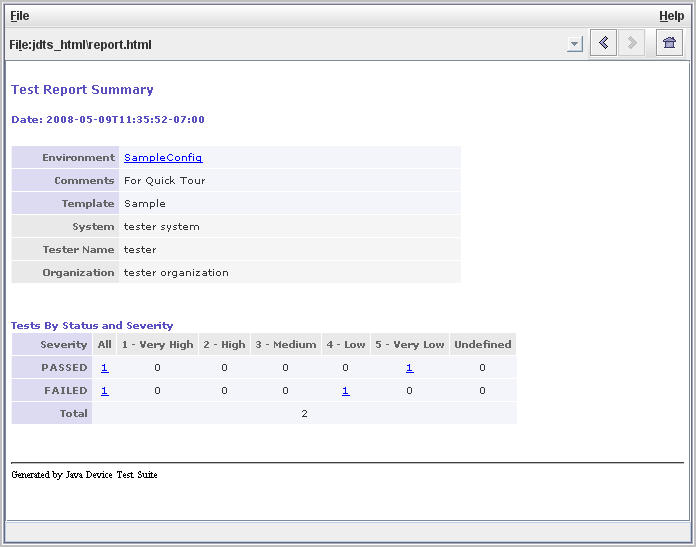
A feature report is organized by device feature. Graphical bars visually indicate the percentage of passed, failed, and not run tests in each feature. To minimize the size of the report, features that have no Passed or Failed tests are not displayed, and their Not Run totals are added to their parent feature. To see report details, click an underscored number.
To create a severity report, follow these steps:
1. In the harness, choose Report > Create Report.
The Create a New Report dialog box, similar to FIGURE 5-31, appears.
3. In the Options tab, check Consider Tests Severities.
5. When the View Report dialog box appears, click Yes.
The first page of the report appears, similar to FIGURE 5-34.
FIGURE 5-34 First Page of Multiple Reports
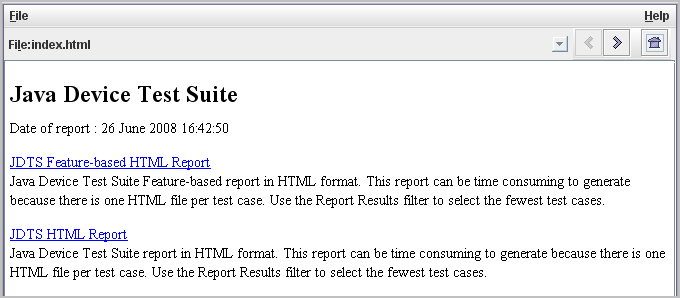
The report organized by severity appears, similar to FIGURE 5-35.
FIGURE 5-35 Report by Severity
